Waveform graph with red and blue oscillations, analysis callouts, grid background, and upward trend arrow. Ideal for analytics, research, trends, data science, visualization predictions simple flat

T Shirt Technical Drawing size chart vector Illustration

Long sleeve Shirt Technical Drawing size chart vector Illustration

T Shirt Technical Drawing size chart vector Illustration

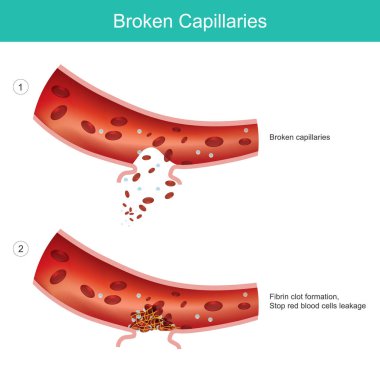
Broken capillaries. caused from blood capillaries expand too much

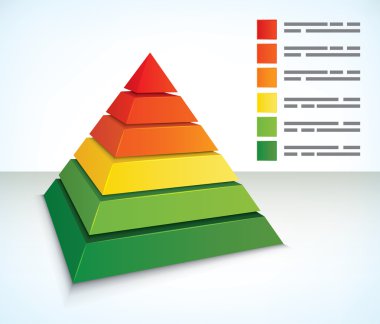
Pyramid diagram with seven component layers in colors graduating from green at the base through yellow and orange to red at the apex with annotated color identifiers on the right

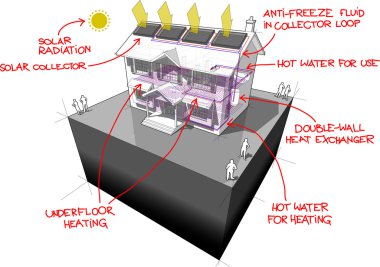
Diagram of a classic colonial house with floor heating and solar panels on the roof with red hand drawn technology definitions over it

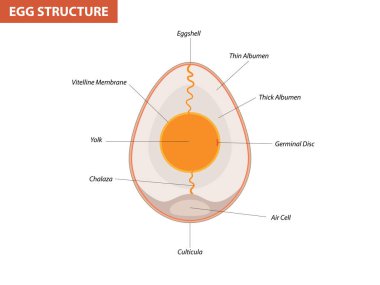
Egg embryo anatomy, section. Bird, Chicken Egg structure

Long sleeve Shirt Technical Drawing size chart vector Illustration

Annotated File web icon vector illustration

T Shirt Technical Drawing size chart vector Illustration

T Shirt Technical Drawing size chart vector Illustration

Annotated File icon on white background, vector illustration

Garment Parts Diagram shirt design

Long sleeve Shirt Technical Drawing size chart vector Illustration

Long sleeve Shirt Technical Drawing size chart vector Illustration

T Shirt Technical Drawing size chart vector Illustration

Long sleeve Shirt Technical Drawing size chart vector Illustration

Diagram of a classic colonial house with air-source heat pump as source of energy for heating and red hand drawn technology definitions over it

Documents stacked with a highlighted tab next to a labeled pie chart organized data analytics. Ideal for analytics, reporting, research, finance, education, presentations, management. Simple flat

Long sleeve Shirt Technical Drawing size chart vector Illustration

Accurate correct usa map with separated states