Waveform graph with red and blue oscillations, analysis callouts, grid background, and upward trend arrow. Ideal for analytics, research, trends, data science, visualization predictions simple flat

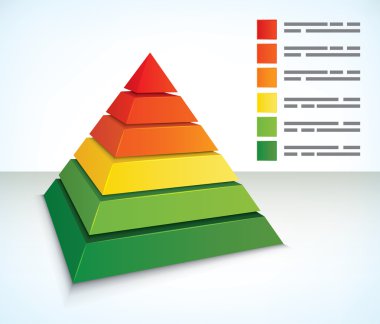
Pyramid diagram with seven component layers in colors graduating from green at the base through yellow and orange to red at the apex with annotated color identifiers on the right

Annotated File icon on white background, vector illustration

Documents stacked with a highlighted tab next to a labeled pie chart organized data analytics. Ideal for analytics, reporting, research, finance, education, presentations, management. Simple flat