Draw in adobe illustrator

A clear visual data chart illustrating CO2 emissions by region in millions of tonnes, suitable for an ecology presentation, energy report, or environmental template.

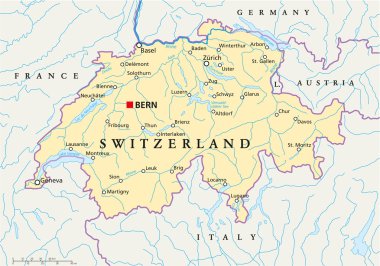
Political map of Switzerland with capital Bern, national borders, most important cities, rivers and lakes with english labeling and scale. Vector illustration using transparencies.

An experimental set-up, with a watch, a large rubber toy balloon filled with carbon dioxide and a glass funnel. Constructed in a way to observe, sound refraction, vintage line drawing or engraving illustration.