
Bar Chart blue gradient vector icon

Vector illustration set of business statistics charts showing various visualization graphs and numbers. Easy to edit vector elements made in a modern flat design.
Bar Chart blue and red four color minimal icon set
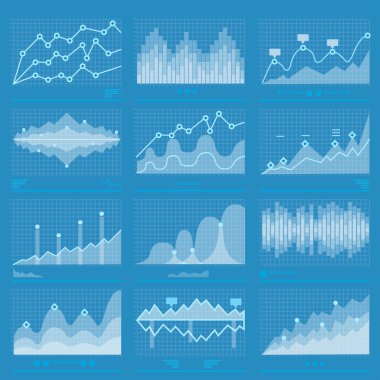
Business statistics and big data marketing analysis infographics banner background EPS 10 JPG JPEG vector illustration

Bar Chart gold plated metalic icon or logo vector

Different financial management reports icon in simple color

Bar Chart silver plated metallic icon

Set of different graphs and charts. Infographics and diagnostics, charts and schemes vector. Business charts and graphs infographic elements. Currency business and market charts vector set.

Bar Chart four color glass button icon

Infographics vector design template. Creative trendy ribbon flat paper style. Useful for annual, business and finance report.

Bar Chart Flat four color minimal icon set
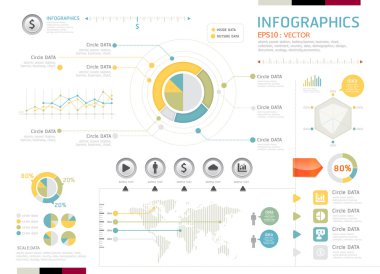
Infographic vector

Bar Chart blue and red four color minimal icon set

Chart icon in flat style. Graph vector illustration on white isolated background.Business concept.

Analytics four color glass button icon

Growth Vector Line Icon isolated on white background.

Analytics four color glass button icon

Illustration representing a businessman explaining how to ensure business growth and development.

Analytics blue and red four color minimal icon set
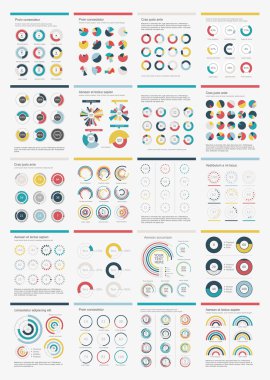
Infographic Elements.Big chart set icon.
Bar Chart blue gradient vector icon

Illustration representing an upset businessman explaining why is the business in the decline stage.

Analytics blue gradient vector icon

Growing red graph chart background. Vector illustration
Analytics Flat four color minimal icon set
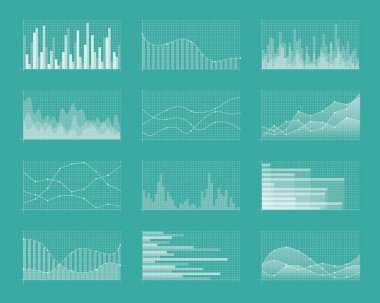
Set of different graphs and charts. Infographics and diagnostics, charts and schemes vector. Business charts and graphs infographic elements. Currency business and market charts vector set.

Analytics blue and red four color minimal icon set

Set of infographics elements
Analytics Green and yellow modern 3d vector icon logo

Bar chart / bar graph with random levels for analysis, visualization concept set

Analytic gold plated metalic icon or logo vector

Fresh collection of various infographic business elements

Analytics four color glass button icon

Data analysis, statistics, analytics - minimal thin line web icon set. Outline icons collection. Simple vector illustration

Analytics blue and red four color minimal icon set

Data analysis, statistics, analytics - minimal thin line web icon set. Outline icons collection. Simple vector illustration

Bar Chart minimal bright yellow material icon

Data analysis, statistics, analytics - minimal thin line web icon set. Outline icons collection. Simple vector illustration

Analytics golden line premium logo or icon

Vector illustration of a bar graph, arrow representing growth

Analytics minimal bright yellow material icon

Data Analytics Flat Vectors Set

Analytics yellow glowing neon icon

Arrow pointing right, bar graph with data points, magnifying glass, and upward arrow. Ideal for business growth, data analysis, market trends, financial progress, performance review strategy

Bar Graph blue and red four color minimal icon set

Laptop screen showing data charts, graphs, and analytics with a rocket taking off. Ideal for business growth, startup projects, analytics, innovation, technology, strategy and simple landing page

Analytics blue and red four color minimal icon set
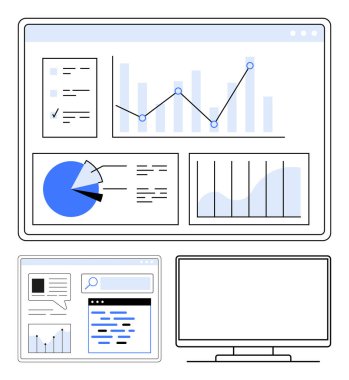
Data analysis dashboard with various charts including line graph, pie chart, and bar graph displayed on computer screens. Ideal for business analytics, presentations, reports, data visualization

Bar Chart yellow glowing neon icon

Data Processing Vector Line Icon

Analytics yellow glowing neon icon
Data analysis, statistics, analytics - minimal thin line web icon set. Outline icons collection. Simple vector illustration

Analytic four color glass button icon

Growth Chart Vector Icon

Bar Chart minimal bright yellow material icon

E-commerce dashboard with pie charts, bar graphs, line graphs, and a percentage indicator. Ideal for online business, data analysis, sales performance, marketing strategy, and technology. Minimalist

Analytics minimal bright yellow material icon

Pie chart and bar graph displayed on digital screens with accompanying data to analyze business performance. Ideal for financial reports, market research, data analysis, business presentations

Analytics minimal bright yellow material icon

This set contains business graphs and charts icons that can be used for designing and developing websites, as well as printed materials and presentations.

Analytics blue and red four color minimal icon set

Need a little financial stability after all that Christmas gift giving? Make a design plan with your Colored Financial Vector Icons! The pack is perfect for all your finance and money projects.

Analytics blue gradient vector icon

Bar graph with seasonal icons, analytical trend line, arrow hitting target, laptop. Ideal for data analysis, seasonal trends, marketing strategy, digital analytics, goal setting business strategy

Analytic silver plated metallic icon

Data analysis, statistics, analytics - minimal thin line web icon set. Outline icons collection. Simple vector illustration

Analytics silver plated metallic icon

Businessman holding a magnifying glass, analyzing data charts on a dashboard. Ideal for business analysis, data visualization, performance metrics, strategic planning, financial reports, market

Bar Chart four color glass button icon

Startup and Development Flat Vector ico

Analysis Green and yellow modern 3d vector icon logo

Growth Chart Vector Icon

Analytics Flat four color minimal icon set

Analytics Glyph Vector Icons

Bar Chart blue gradient vector icon

Loss bar chart icon. Vector illustration. EPS 10

Bar Chart yellow glowing neon icon

Analytics Line Vector Icons

Analytics golden line premium logo or icon

Growth Vector Line Icon isolated on white background.

Analytics blue gradient vector icon

Data Science Color Isolated Vector icons set every single icon can easily modify or edit

Bar Chart gold plated metalic icon or logo vector

Graph Presentation Vector Icon

Analysis minimal bright yellow material icon

This set contains business graphs and charts icons that can be used for designing and developing websites, as well as printed materials and presentations.

Analytic blue gradient vector icon

3D business decline graph. Vector business concept

Bar Chart four color glass button icon

This set contains business graphs and charts icons that can be used for designing and developing websites, as well as printed materials and presentations.

Bar Graph Green and yellow modern 3d vector icon logo

Data analysis. Vector illustration. Information management is crucial for organizing and analyzing vast amounts data effectively Market research and analytics are essential for understanding consumer

Analysis golden line premium logo or icon

Investment design concept set with money saving and stock market profit flat icons isolated vector illustration

Bar Chart four color glowing neon vector icon
Data analysis set icon on white background

Bar Chart yellow glowing neon icon

Set of vector line pattern.

Analytics minimal bright yellow material icon

Battery Vector Icon Business and office line vector icon.