
Analytics gold plated metalic icon or logo vector

Large and small clouds with a hand pointing toward one, representing decision-making, options, growth, and evaluation. Ideal for business, education, strategy, goal-setting concepts weather simple
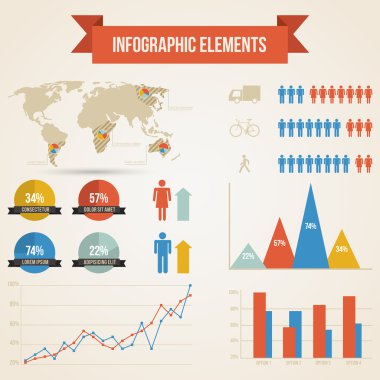
Infographics with a population

White coupon banner with word comparison from machine on blue color background
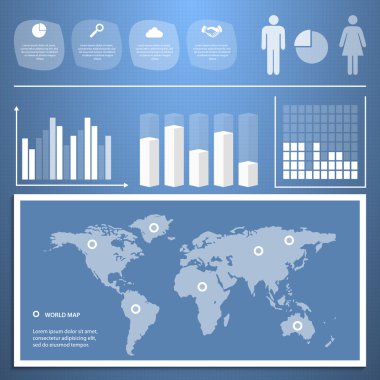
Infographics with a population

Comparison chart with five elements and legend, infographic template for web, business, presentations, vector eps10 illustration

Analytics Flat four color minimal icon set

Isometric vector image on a blue background, comparison of different types of diagrams and magnifier, study and comparison of statistical data

Analytics blue and red four color minimal icon set

Gap analysis as current and desired performance comparison level outline diagram concept. Labeled educational scheme with ambition and reality difference in time and revenue axis vector illustration.
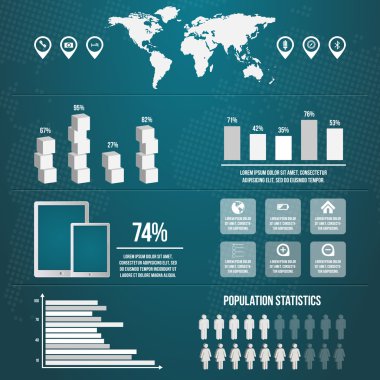
Infographics with a population

Swing trading vs. day trading, a diagram contrasting timeframes and strategies. Key objects, charts, buy-sell indicators. Neubrutalism style diagram.

Analytics blue gradient vector icon

The slide is titled 'Metrics that Matter'. It displays business analysts reviewing charts and graphs related to email performance

Analysis four color glowing neon vector icon

Products compare. Comparison price table with option line icons. Versus infographic bar chart. Product choice service graph vector concept. Compare function description, choosing product

Analysis Green and yellow modern 3d vector icon logo

Comparison Infographic Design Template, business presentation concept with 2 options, To do list or planning icon, Good, bad, Positive, Negative, vector illustration.

Analytics four color glass button icon

Benchmark performance or KPI key performance indicator, metrics or measurement to measure success, result evaluation, analysis or comparison concept, businessman magnify benchmark metric graph scale.

Vector infographics on a black background

Simple concept for swot analysis concept with four steps and place for your description - blue version. Flat infographic design template for website or presentation.
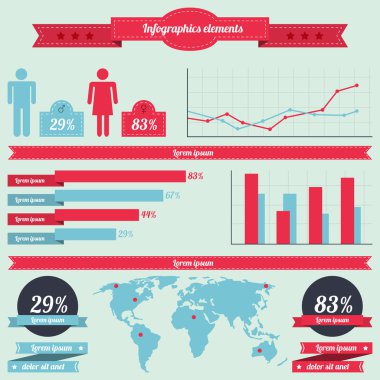
Infographics with a population

Stack of documents beside a monitor displaying graphs, charts, and analytical data. Ideal for business, analytics, reporting, data visualization, research, strategy presentations simple landing
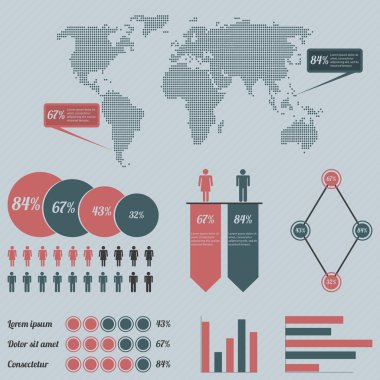
Infographics with a population

Justice balance isolated icon vector illustration design

Vector infographics on a black background

Data analytics, big data statistic concept

Infographics with a population

Color business graph and chart set. bar, line, areas, bubble and candlestick graphs. analysis graphic vector images in flat style
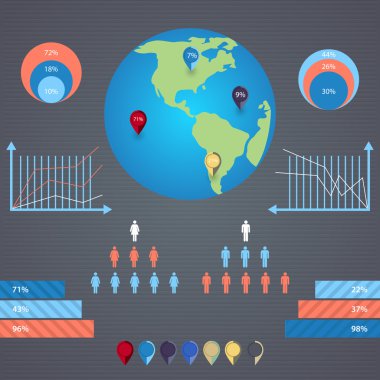
Vector infographics with a population

Symbol of the dollar and the euro on the scales. vector. flat illustration
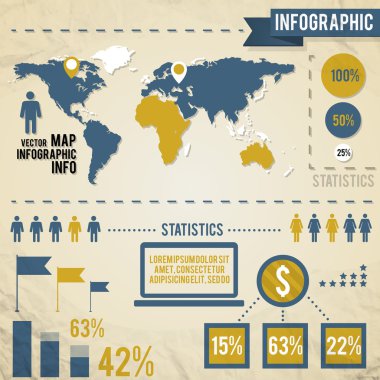
Infographics with a population

Red color inserted label with word comparison on gray background
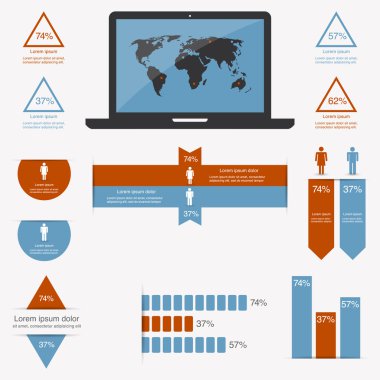
Infographics with a population

Businessman has an idea on scales. Value of idea

Analysis four color glass button icon

Dual balance scales icons with vintage mechanical beam balance scales with decorative stands, figured levers and weighing pans. Scales of justice and balance themes design usage

Analysis blue gradient vector icon

Bar chart with legend, line graph with data points, and percentage icon. Ideal for finance, data analysis, business growth trends, marketing metrics, reporting tools, education abstract line flat

Analytics Green and yellow modern 3d vector icon logo
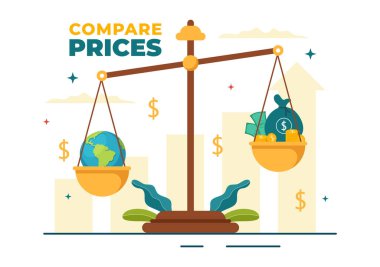
Compare Prices Vector Illustration of Inflation in Economy, Scales with Price and Value Goods in Flat Cartoon Hand Drawn Landing Page Templates

Analytics golden line premium logo or icon

Vector illustration of a balance

Analytics silver plated metallic icon

Golden weight balance vector drawing illustration

Analytics four color glowing neon vector icon

Making choice, measuring values concept. Human hand putting finger to one side on scales making decision and choice vector illustration

Analysis Flat four color minimal icon set

Pros cons comparison, Make Decision, optimal solutions. Correct Wrong. Vector stock illustration

Analytics yellow glowing neon icon

Illustration On Dark Background. Data Analytics, Info Checkup Concept. Isometric Vector Composition In Cartoon 3D Style With Objects And Text. People Standing Near Laptop With Charts And Diagrams.

Analysis blue and red four color minimal icon set

Scales of Justice. vector

Analysis yellow glowing neon icon

Scales balance sign. Flat style icon on transparent background

Analysis golden line premium logo or icon

Balance vector illustrations

Analysis gold plated metalic icon or logo vector

Simple diagram for business analysis. Easy to use for your website or presentation.

Analysis minimal bright yellow material icon

Vector illustration of a balance

Analytics minimal bright yellow material icon

Set icons of graph and diagram isolated on black. Vector illustration
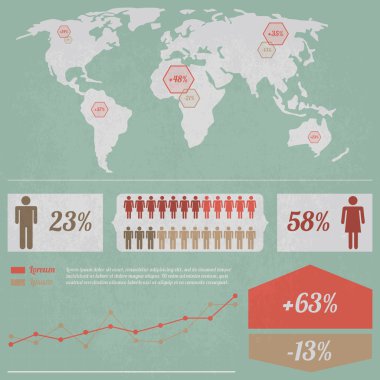
Infographics with a population

Data analysis statistic for big data interpretation detailed outline line icon set
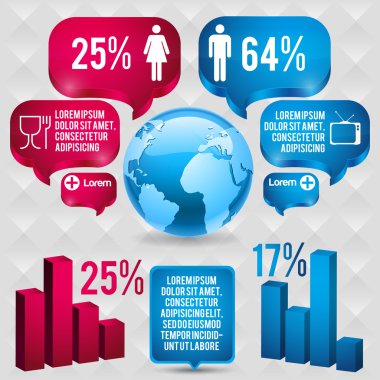
Infographics with a population

Megaphone icon with speech bubble in word comparison on white background

Business report symbol with some sheets of paper and graphs. Easy to use for your website or presentation.

Vector illustration of a silver balance.

Scale of justice. Law and Justice. Flat vector cartoon illustration. Objects isolated on white background.

Histogram charts. Business infographic template with stock diagrams and statistic bars, line graphs and charts for presentation and finance report. Vector set charting on dashboard

Data and analytical research concept with laptop and magnifying glass icon flat vector illustration

Gold balance symbol of justice. Vector illustration.

Scale icon

Businessman Presenting Statistics Infographic Icons Set, Flat Design Business Data Visualization

Scales icon. Libra isolated on white background. Vector illustration.

Justice scale icon. White background. Grading pictogram scale Vector illustration.

Infographic charts and diagrams - set of modern vector isometric elements isolated on white background. High quality colorful images of different graphs. Business analytics, statistics concept

Set line icons of graph and diagram isolated on white. Vector illustration

Data analysis, financial analytics isometric vector illustration. Cartoon 3d analyst trader workplace with laptop and big chart graph information, finance research business technology landing page

Continuous line drawing of law symbol of weight balance

Scales of justice icon. Empty scales. Law balance symbol. vector illustration.

Justice scale isolated icon vector illustration design

User profile document next to a graph with points and target focus icon. Ideal for analytics, statistics, performance metrics, user research, goal tracking, insights, abstract line flat metaphor

Concept of data visualization. A man collects data, builds graphs, charts and tables, and a woman works at a computer. Isometric cartoon vector illustration for website template

Scales of Justice

Scale icon on white background. Vector illustration.

Scale icon

Value and Price balance on the scale. Business Concept

Scale icon design. justice sign and symbol.

Metal balance scale gold isolated on white. Vector illustration.

Icon of Scales, justice, law vector illustration on blue

Scales of justice icon. Empty scales. Law balance symbol. vector illustration.

Scale comparison icon in flat style. Balance weight vector illustration on white background. Scale compare business concept.

Scales balance sign. Flat style icon vector illustration

Balance scale icon in simple style on a white background vector illustration

3D Isometric Flat Vector Illustration of Quality and Performance, Efficiency Improvement

Empty scales. Scales of justice. Law balance symbol. Libra. Vector illustration

Simple concept for swot analysis concept with four steps and place for your description. Flat infographic design template for website or presentation.