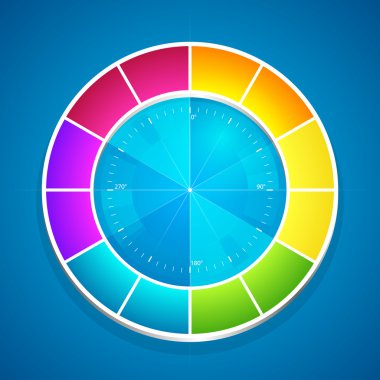
Vector illustration of a color wheel.

Business Data Graph and Charts Icon Set

Business Data Graph and Charts Icon Set

Business Data Graph and Charts Flat Icons

Business Data Graph and Charts Icon Collection

Vector Infographic timeline report template with icons and descriptive bubbles

Business Data Graph and Charts Icon Pack

Business Data Graph and Charts Vector Pack

Abstract vector illustration with reflection and shadow eps 10

Business Data Graph and Charts Vector Icons

A bar graph with the infographics representing descriptive statistics

Business Data Graph and Charts Icon Collection

Business Data Graph and Charts Glyph Icons

3d pie chart graphic for infographics or reports

Color circle graph for design and business concept

Color graph for design and business concept

Graphical Analysis Line Icons Pack

Set elements of infographics. Eps 10.

Infographics elements in blue and yellow colors. Editable vector illustration. Eps 10.

Infographics elements. Vector illustration. Eps 10.

Infographics elements. Editable vector illustration. Eps 10.

Research Process and Methods, Type of Research From Application, Objectives and Information Sought

Set elements of infographics. Eps 10.

Elements of infographics. Eps 10.

Element of infographics. Diagram template vector illustration.

Element of infographics. Diagram template vector illustration.

Business graph

Infographics elements. Charts and graphs templates vector illustration. Eps 10.

3D bar graph with map

Abstract colorful business chart background vector illustration

Business graph isolated on white background

Element of infographics. Paper diagram vector illustration.

Abstract progress chart vector illustration

Abstract colorful business chart vector illustration

Set elements of infographics. Eps 10.

Multi Colored arrows that move up

Graph going up vector drawing on the laptop monitor

Color graph for design and business concept - red vector

Graph background

Color graph for design and business concept

An icon showing graphical infographics conceptualizing descriptive statistics

Elements of infographics

Infographics elements. 3d pie charts.

Chart with arrows. vector

Business Data Graph and Charts Icon Pack

Vector dark Infographic timeline report template with icons and descriptive bubbles

Infographics elements. Diagram templates vector illustration. Eps 10.

Multi-colored arrows moving in a circle

Growth chart icon set white color vector illustration flat style simple image outline

Finance and banking icons in grey circular button with a shadow underneath

Multi-colored arrows moving in a opposite directions

Color guides with shades over white. Vector illustration

Medical infographics elements vector illustration. Eps 10.
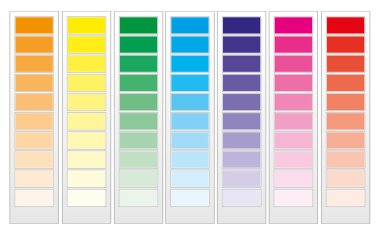
Color guide chart, cmyk rainbow background, part 1, vector illustration

Red and yellow arrows moving in a opposite directions

Green nature bokeh login page
Multi Colored arrows are intertwined

Multi-colored arrows rounding

Abstract colorful business chart vector illustration

Dark series, business , office,work icon set

Arrows that envelop the ball

Arrows are away from the ball

Icons for Web 2.0

Red arrows moving in a circle

A bar graph with the infographics representing descriptive statistics

Rainbow colour book background
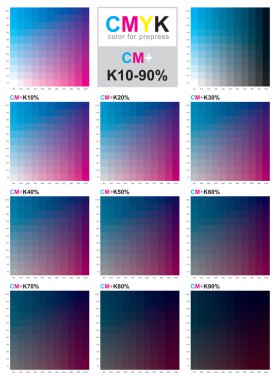
The CMYK color model is a subtractive color model, used in color printing, and is also used to describe the printing process itself. CMYK refers to the 4 inks used: cyan, magenta, yellow and black

Green nature bokeh login page

The CMYK color model is a subtractive color model, used in color printing, and is also used to describe the printing

The CMYK color model is a subtractive color model, used in color printing, and is also used to describe the printing process itself. CMYK refers to the 4 inks used: cyan, magenta, yellow and black

Rainbow colour book background

Arrows leading up

Web icons set

Office and Organization Icons

Business Data Graph and Charts Vector Pack

Vector illustration of PANTONE

Illustration of a color guide

Internet icons

Set of batteries in an hourglass isolated on a black background

Multi-colored arrows moving in the right side

Comparison diagram flat design long shadow glyph icon. Cluster diagram. Contrast objects symbolic representation. Comparison among categories. Histogram on scales. Vector silhouette illustration
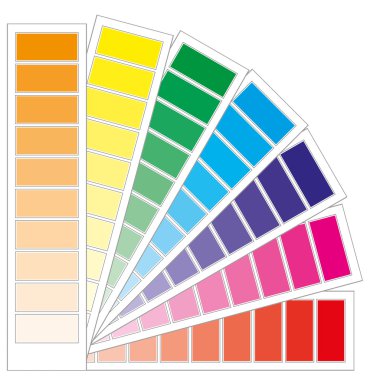
Color guide chart, cmyk rainbow background, part 3, vector illustration

Comparison diagram color icon. Cluster diagram. Contrast objects symbolic representation. Visual comparison among discrete categories. Histogram on scales. Isolated vector illustration

Arrows moving in the right side and upwards

Pantone colors graphic design, vector illustration eps10

Green nature bokeh login page
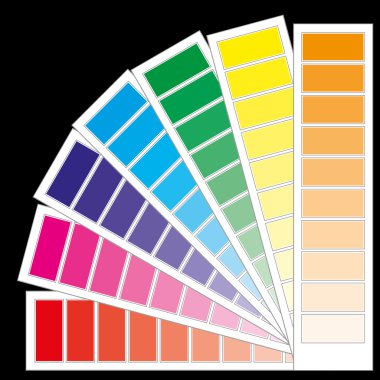
Color guide chart, cmyk rainbow background, part 4, vector illustration

Puzzle piece business presentation, vector

Xs, s, m, l, xl, xxl

Abstract vector background.

Abstract background

Color palette isolated on white eps10

Vector illustration of color fan

Business Data Graph and Charts Vector Icons

Graph with some values having focus and target arrow exact in the middle, presenting stats based targets icon

A bar graph with the statistics representing business infographic

Descriptive Analytics web icon vector illustration

Descriptive Analytics web icon vector illustration

Descriptive Analytics web icon vector illustration

Descriptive Analytics web icon vector illustration