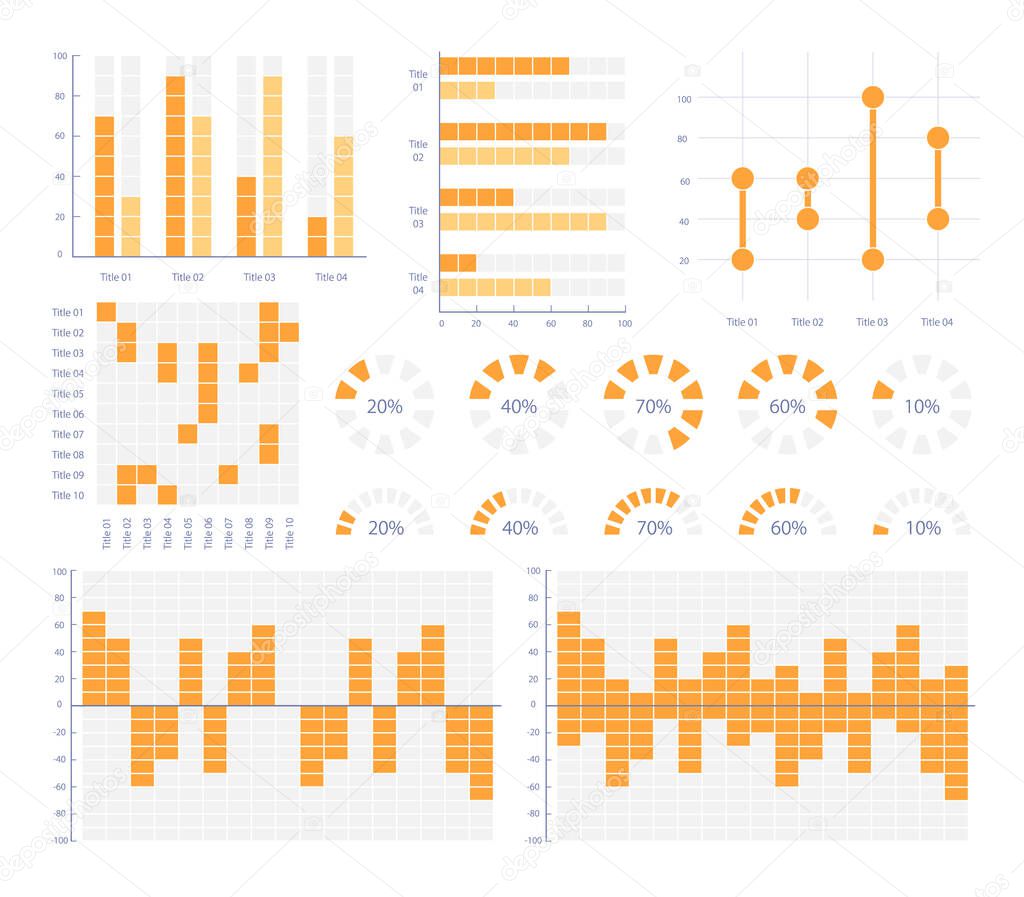
Business development results infographic chart design template set. Visual data presentation. Editable bar graphs and circular diagrams collection. Myriad Variable Concept font used premium vector by bsd_studio

Please buy a commercial licence for commercial use without attribution.
vector number circle graphic design set pack business percentage orange line creative data simple information Presentation template science layout study dashboard report research graph chart process option result statistics info diagram waterfall editable visualization customizable bundle stats histogram bars analytics personalize piechart infographic pie chart infochart infograph dot plot dot chart scattered plot
Categories:Array ( ) 1
tags:
vector
number
circle
graphic
design
set
pack
business
percentage
orange
line
creative
data
simple
information
Presentation
template
science
layout
study
dashboard
report
research
graph
chart
process
option
result
statistics
info
diagram
waterfall
editable
visualization
customizable
bundle
stats
histogram
bars
analytics
personalize
piechart
infographic
pie chart
infochart
infograph
dot plot
dot chart
scattered plot