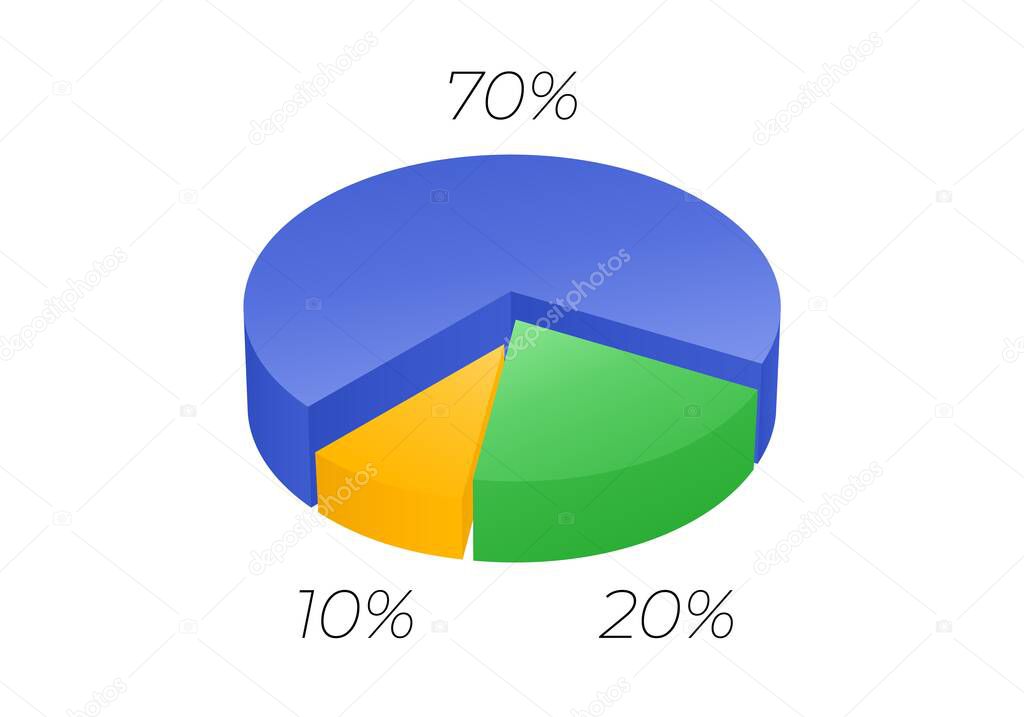
Isometric cycle diagram for infographics. Vector chart can be used for graph, report, presentation, brochure, web design. 3d pie. premium vector by April_Ola

Please buy a commercial licence for commercial use without attribution.
Bar vector round colorful graphic illustration design shape business growth pie framework 3d three symbol creative concept icon percent part step Presentation ring project gradient geometric economy strategy company dashboard share chart process ten circular progress statistics info diagram 20 10 stats twenty segment 70 isometric seventy analytics infographic
Categories:Array ( ) 1
tags:
Bar
vector
round
colorful
graphic
illustration
design
shape
business
growth
pie
framework
3d
three
symbol
creative
concept
icon
percent
part
step
Presentation
ring
project
gradient
geometric
economy
strategy
company
dashboard
share
chart
process
ten
circular
progress
statistics
info
diagram
20
10
stats
twenty
segment
70
isometric
seventy
analytics
infographic