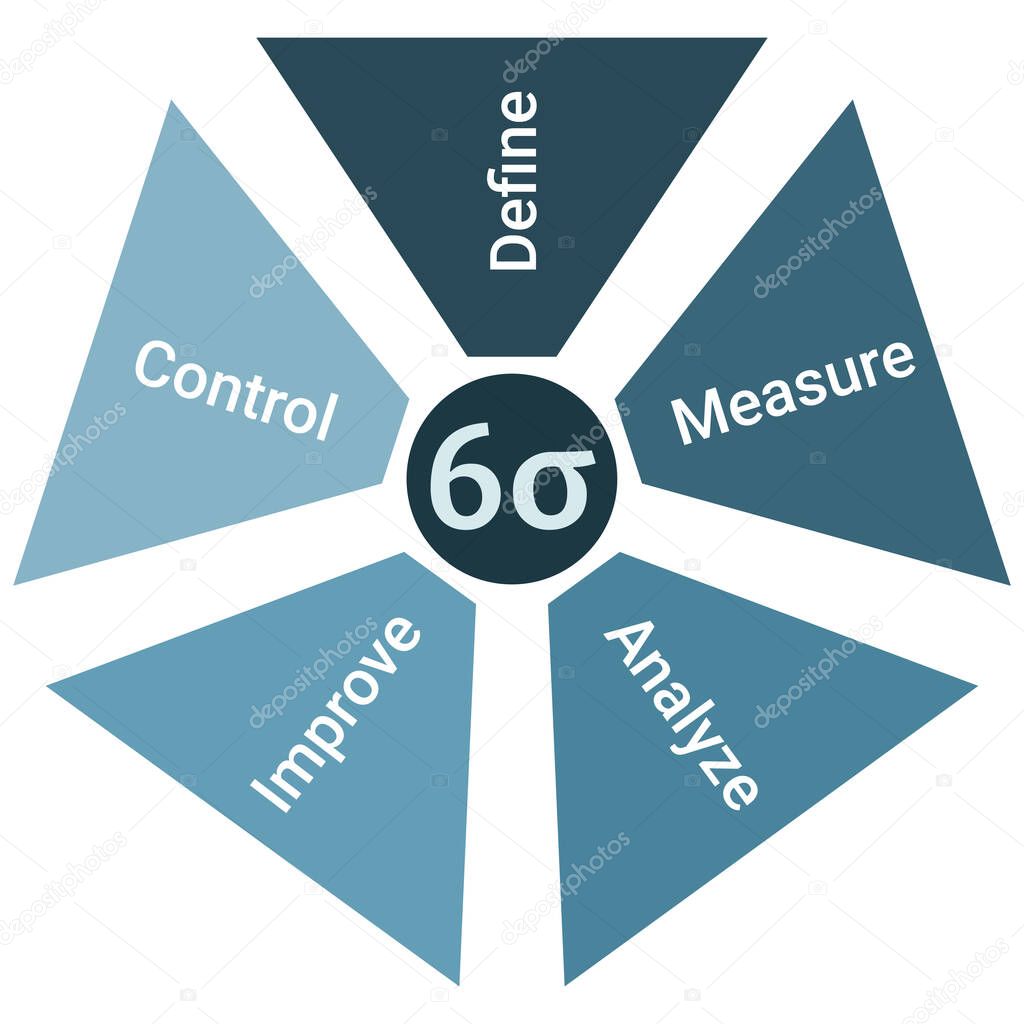
Six sigma methodology life cycle diagram scheme infographics with define, measure, analyze, improve and control premium vector by Litteralis

Please buy a commercial licence for commercial use without attribution.
blue vector circle graphic illustration design business model arrow concept flow flat development measure test Presentation web project strategy production engineering improve control analysis management chart process scheme six diagram analyze software define method iterative integration schema implementation workflow iteration sigma deployment deploy methodology Lifecycle infographic six sigma
Categories:Array ( ) 1
tags:
blue
vector
circle
graphic
illustration
design
business
model
arrow
concept
flow
flat
development
measure
test
Presentation
web
project
strategy
production
engineering
improve
control
analysis
management
chart
process
scheme
six
diagram
analyze
software
define
method
iterative
integration
schema
implementation
workflow
iteration
sigma
deployment
deploy
methodology
Lifecycle
infographic
six sigma