
Vector infographic elements. vector illustration

Infographics collection hand drawn doodle sketch business ecomomic finance elements.

Set of infographic elements

Illustrated growth bar graph showing increasing metrics and data points for progress

Set of infographic elements

Abstract multilayered chart visualizing dynamic data trends in the information space
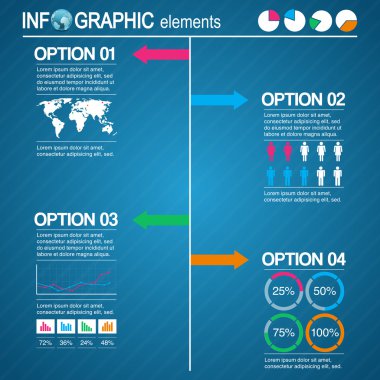
Set of infographic elements

A curated collection of 10 Solid Filled-style icons centered on Graph. Ideal for creative, tech, or business projects.
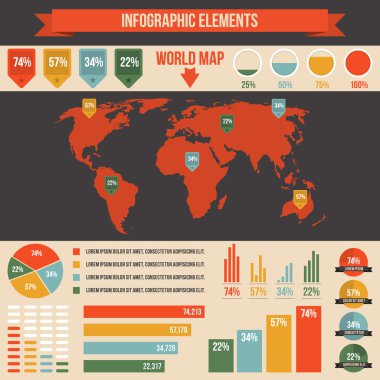
Set of infographic elements

Businessman analysing business chart Illustration
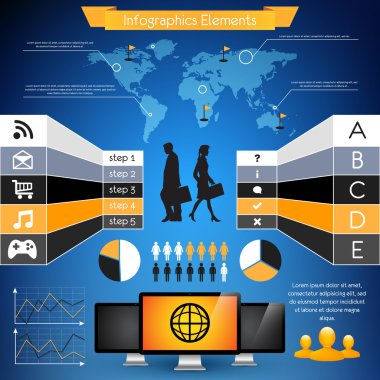
Set of infographic elements

Vector illustration of a financial chart using candlestick patterns. Green and red bars indicate market trends on a grid background
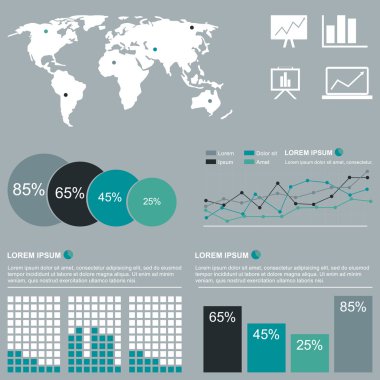
Set of infographic elements

An upward trending bar graph symbolizing growth, progress, and data analysis
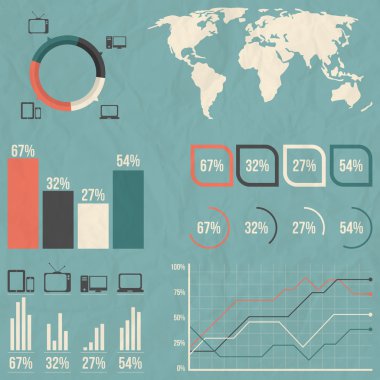
Set of infographic elements

Flat vector illustration of a computer display showing data charts and analytics, representing business performance, reporting, and financial analysis, isolated on white background.
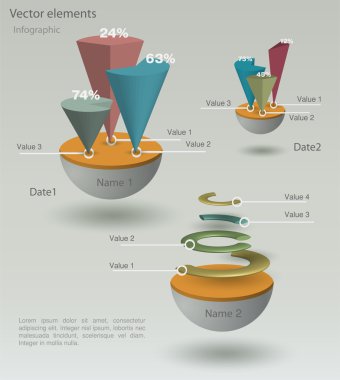
Paper Origami Infographic Elements

Infographic elements in vector illustration
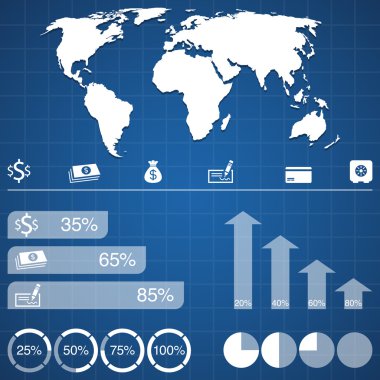
Set of infographic elements

Modern set of charts, including radial diagrams, line graphs, bar charts, showcasing financial and statistical trends. Professional reports. Concept of global economics, financial analytics, business
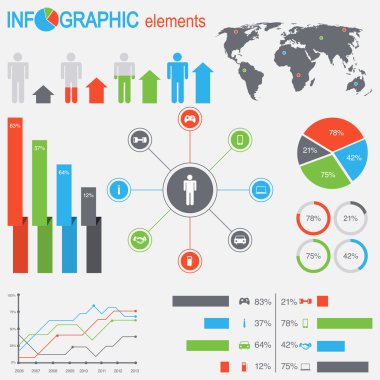
Set of infographic elements

E Commerce Market Performance Illustration concept. Statistical and Data analysis for business finance investment concept. Vector illustration with purple background

Set of infographic elements

Inventory management methods rectangle infographic vector. Supplies operation control. Data visualization with 5 steps. Editable rectangular options chart. Lato-Bold, Regular fonts used
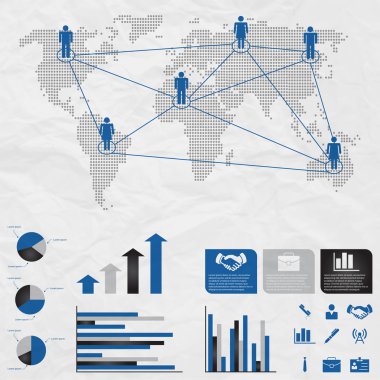
Set of infographic elements

Growth icon set for revenue increase, business development, profit trends, and financial upturn
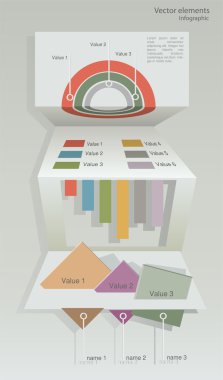
Paper Origami Infographic Elements

A set of conceptual elements to create your infographics.
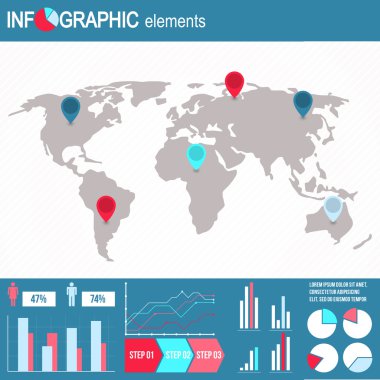
Set of infographic elements

A set of conceptual elements to create your infographics.
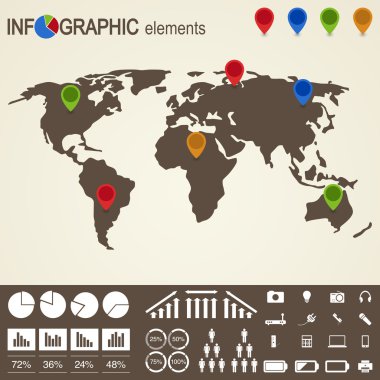
Set of infographic elements

A set of conceptual elements to create your infographics.
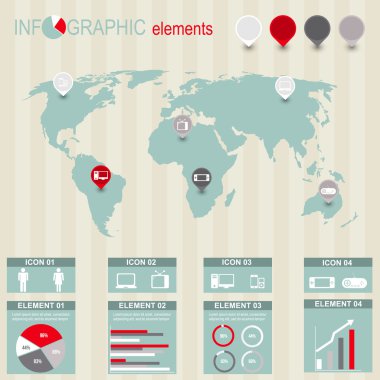
Set of infographic elements

Set of elements for the development of creative infographics.
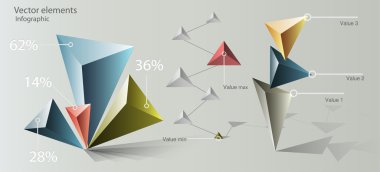
Paper Origami Infographic Elements

A set of conceptual elements to create your infographics.
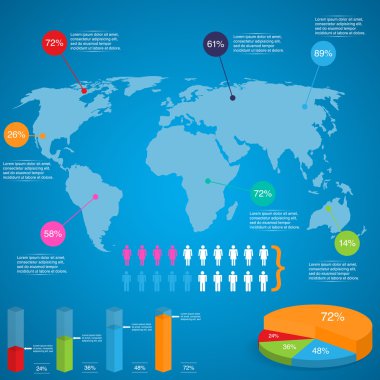
Set of infographic elements

A set of conceptual elements to create your infographics.
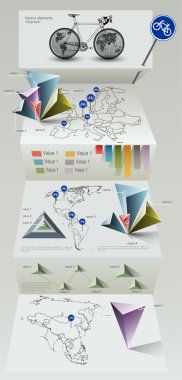
Paper Origami Infographic Elements

A set of conceptual elements to create your infographics.
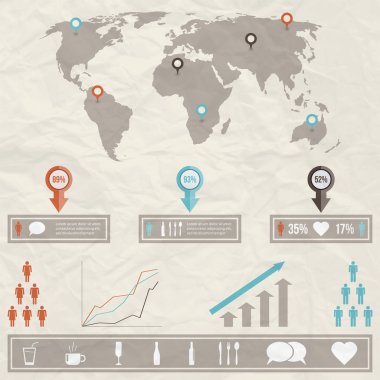
Set of infographic elements

Magnifying glass over line graph with blue data points. Arrow pointing downward. Ideal for analytics, trends, growth, research, decision-making, finance, education abstract line flat metaphor

Set of infographic elements

A set of conceptual elements to create your infographics.

Set of infographic elements

A set of conceptual elements to create your infographics.
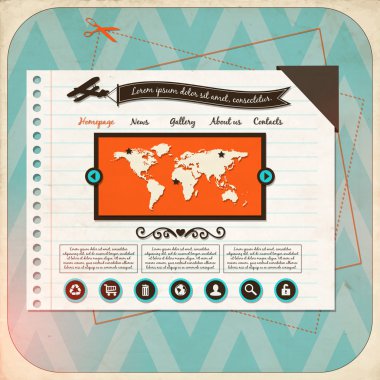
Set of infographic elements

A set of conceptual elements to create your infographics.

Set of infographic elements

A set of conceptual elements to create your infographics.

Set of infographic elements
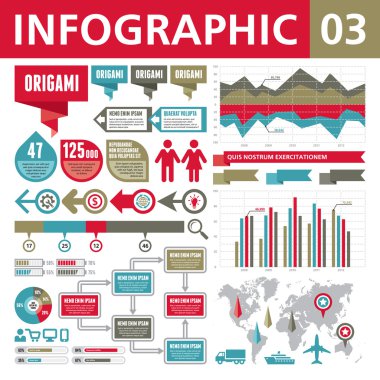
A set of conceptual elements to create your infographics.

Paper Origami Infographic Elements

A set of conceptual elements to create your infographics.

Vector set of web icons.

Dashboard grfico de las estadsticas de divisas, negocios y anlisis financiero, la tasa de beneficios y costes, ilustracin vectorial
Vector buttons with infographic elements.

A set of conceptual elements to create your infographics.

Vector set of web icons.

A set of conceptual elements to create your infographics.

Vector set of web icons.

Set of elements for the development of creative infographics.

Vector set of web icons.

A set of conceptual elements to create your infographics.

Vector set of web icons.

A set of conceptual elements to create your infographics.
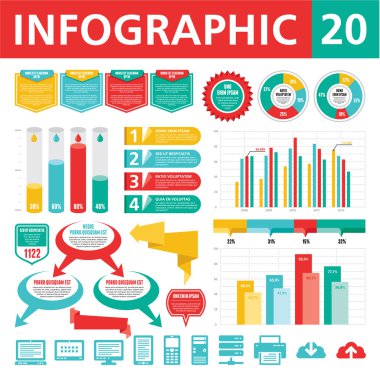
A set of conceptual elements to create your infographics.

Infographics Elements. Vector Illustration

A set of conceptual elements to create infographics, presentations and different design works.

Business infographics set with different diagram vector illustration. Abstract data visualization elements, marketing charts and graphs. Website, corporate report, presentation, advertising template

Isometric data tools finance diagram, bar chart and area graphic set. 3D statistical and marketing data visualization neon elements. Vector Illustration for web site, presentation, apps, infographics

Vibrant bar chart with upward arrow

Isometric infographic elements with charts, statistics, data visualization, analysis, report, bar diagrams, graphs in flat 3D design isolated on white background.

Business infographic elements data visualization vector design

Infographic elements in vector illustration

Business statistics and data analysis isometric vector icon, data visualization, teamwork leader

Infographic elements, vector illustration.

Business infographic elements data visualization vector design.

Economy infographic with puzzle. Vector isometric 3D illustration

Infographics Elements. Vector Illustration

Business infographics concept set vector illustration. Data visualization, step process chart, product development stage, info diagram elements.

Infographic Elements

Business infographic elements data visualization vector design.

Vector set of infographics with steps, options. For infographic, banner, poster, web design

Infographics Elements. Vector Illustration

Set of Infographic Elements. Icons and Information

Business infographics concept set vector illustration. Data visualization, step process chart, product development stage, info diagram elements.

Infographics concept with icons in flat design style for your presentation and other works.

Business infographic elements data visualization vector design

Business infographic elements data visualization vector design.

Business infographic elements data visualization vector design

A set of conceptual elements to create your infographics.

Vector set of infographics with steps, options. For infographic, banner, poster, web design

Types of water scarcity infographic 3 steps. Ecology problem handling. Environment care. Flow chart infochart. Editable vector info graphics icons. Montserrat-SemiBold, Regular fonts used

Business Graph and Chart Icon Set in Flat Vector Style

Collection of graph icons showing upward trends

Three segments of a pie chart conveying data segmentation, gear icon for process, dollar symbol for finance. Ideal for analytics, business, finance, strategy, economy data insights planning. Simple

Pie chart with three colored segments, heartbeat line inside a heart, and stacked coins emphasize financial planning, health management, budgeting, analytics, healthcare costs, decision-making

Illustration of the Bitcoin symbol placed alongside an ascending arrow and bar graph, signifying cryptocurrency value increase. This image is ideal for themes involving finance, investment, and cryptocurrency growth

An isolated, minimalist illustration shows a vibrant bar chart, perfect for infographic design, reports or presentations. Features colorful bars with modern, cartoon-like style.