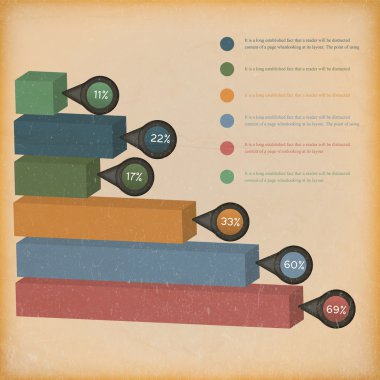
Colorful 3d diagram, vector illustration

Green graph is growing up on the white background.
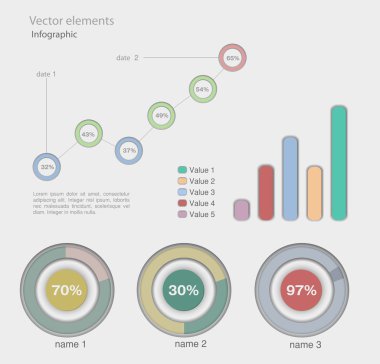
Infographic Vector Graphs and Elements.

Illustration of business bar graph with arrow
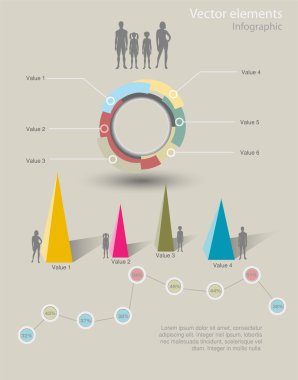
Infographic Vector Graphs and Elements.

Vector illustration set of business statistics charts showing various visualization graphs and numbers. Easy to edit vector elements made in a modern flat design.

Business background in blue with financial figures and graph
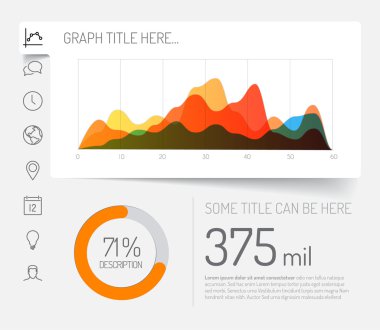
Simple infographic dashboard template with flat design graphs and charts - light version

Business vector Graph with arrow showing profits and gains

3d graph displaying the forecast

Stock Market Graph and Bar Chart

Hand drawn business infographics finance elements on squares paper background

A set of pictograms representing business and finance.

Physics seamless pattern with the equations, figures, outlines, formulas and other calculations on whiteboard. Retro scientific and educational handwritten vector background.

Vector flat design infographics statistics bar graph - grunge retro version - infographic element

An illustration stock quote a figure rising

Business vector line icon set isolated on white background. Business line icon set for infographic, website or app. Scalable icon designed on a grid system.

Set of vector business doodle elements. Hand drawn business icons set. Business, diagram, progress, graphs, arrows and all other kinds of business related elements.

Set of vector flat design infographics hierarchy diagram - part 5 of my infographic budndle

Business charts

Vector flat design infographics statistics chart and graph - grunge retro version - infographic element

Abstract futuristic technology background of Chart graph lower low candle stick green and red

Doodle business set

Colour business finance chart with data and arrows

Business inspired financial background with graph and copy space

Vector flat design statistics column horizontal graph template for your infographics
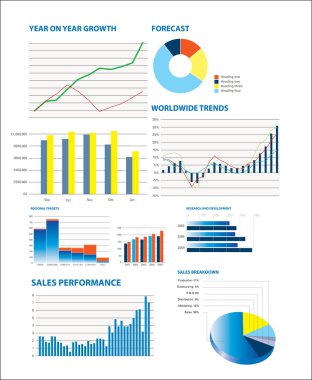
Business performance data including sales figures and charts

Illustration of Blue Stats Graph isolated on a white background

Vector flat design statistics vertical column graph template for your infographics

Accounting. Financial planning with calculator and pencil in flat design style

Business Graph with arrow showing profits and gains background or card

Paris, France - october 28, 2019: stock market index and real rates with a green shade

Infographics page with a lot of design elements like chart, globe, icons, graphics, maps, cakes, human shapes and so on. Ideal for business analisys rapresentation.

Stock market analysis. Finance concept illustration.

3d graphs showing rise and fall in profits or earnings - vector illustration

Business data presentation with graphs and charts on a computer screen and two professionals discussing the data. Ideal for business analysis, data visualization, teamwork, presentations, and market

Graph showing rise

Illustration of graph and number showing stock market listing

Hand doodle Business doodles

3d graph showing rise in profits or earnings

Vector Background illustration of Finance Stock

Hand-drawn finance illustration

3d growing chart

Cuter Economy Monitor Chart

Vector business diagrame which red arrow on the white background, vector illustration

Set of vector flat design infographics statistics charts and graphs - fresh retro color version

Increased profits in the business. Up arrow. Vector illustration

Growing graph

Business graph with arrow showing profits and gains, banner

Statistic charts, surrounded by 3d arrow

Stock Market Data - Illustration

Set of vector flat design infographics statistics charts and graphs -blue and green version

Agriculture business growth graph concept

Dark Infographics page with a lot of design elements like chart, globe, icons, graphics, maps, cakes, human shapes and so on. Ideal for business analisys rapresentation.

Arrows in perspective

Business man stick figure with a profit graph.

Candlestick stock exchange background vector

Vector watercolor graphics. The original design for you

Graph showing rise in profits or earnings

Financial stock market background with world map figures and graph

Stock market figures on a background ideal for reports or finance

Set of vector flat design infographics statistics charts and graphs - blue and green version

Illustration of business financial graph with stock listing

Vector watercolor graphics. The original design for you

An illustration stock quote a figure down

Stock market crash illustration - red arrow on world map

Set of vector flat design infographics statistics charts and graphs - on brown background

Information graphic. simply symbol for web icons

Graphs and figures showing an increase. Abstract economic charts.

Vector 3D graph

Business professional pointing at cloud computing icon with a display of data analytics on a screen. Ideal for data analysis, business strategy, cloud computing, technology trends, market research

Original Vector Illustration: businesswoman holding computer laptop internet background with city and stocks AI8 compatible

Flat design modern vector illustration concept of analyzing business rise, ideas for future growth, analytics of further financial and economic future. Isolated on stylish colored background

Business finance elements. Hand-drawn

Business graph moving down. chrisis.

Financial report flat illustration concept. Top view. Modern flat design concepts for web banners, web sites, printed materials, infographics. Creative vector illustration

Vector flat design statistics column horizontal graph template for your infographics made from paper stripes

Stock chart illustration, world map , figures and graph

Hand drawn business infographics seamless pattern on green background or blackboard

Set of business chart vector line icons.

Yield curve with team working together on the table vector illustration

Businessman with graph and Skyline Original Vector Illustration Businessmen Concept

Business finance elements. Hand-drawn

Graph with upward direction arrow for Revenue and downward for costs to show ideal position for growth of profits in dollars

Concept of data visualization. A man collects data, builds graphs, charts and tables, and a woman works at a computer. Isometric cartoon vector illustration for website template

Modern vector icon of financial data development, wealth monitoring and audit. Premium quality vector illustration concept. Flat line icon symbol. Flat design image isolated on white background.

Global portfolio asset allocation, world stock market investment, international market share pie chart, financial or world economic concept, businessman work with computer laptop on world pie chart

Creative Artwork of bear and bull heads, vector illustration, animal concept

Drawing Bull and Bear on yellow background, Artwork Concept, Vector Illustration

Business illustration showing stock market figures on a grid
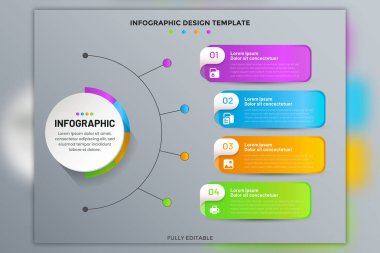
EPS Vector Creative infographic design template for data visualization

Businessmen analyze financial success with growth chart and money icons.

Seven population infographic set icons

Business doodles - seamless pattern

A glowing bull with raised front legs has a stock trading line as an element.

Diagramme From Segments. Vector. 90% and 10%

Business doodles sketch handrawn

Business team get financial loss.

Infographics Page Template. Graphs and Charts. Illustration Vector

Business Chart with colored bars and up arrow