10 FREE IMAGES of ShutterstockTry Shutterstock and Get 10 Free Images

graph representation SVG, Vector And Clipart Images

() graph representation SVG Vectors and Transparent background graph representation ClipArts. All Download the royalty free graphic in the form of SVG, PNG, EPS, AI or PSD.

Description:

Usage ideas:

Monitor displaying growth chart, line graph, checklist, and report elements. Gear inside lightbulb, clock represent innovation, productivity, and time management. Ideal for data-driven strategy clipart svg vector

Monitor displaying growth chart, line graph, checklist, and report elements. Gear inside lightbulb, clock represent innovation, productivity, and time management. Ideal for data-driven strategy
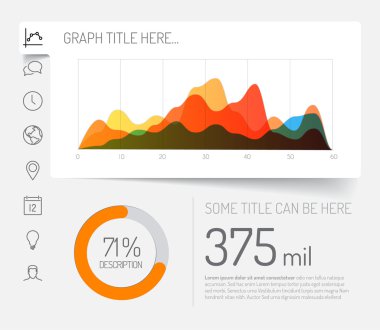
Simple infographic dashboard template with flat design graphs and charts - light version clipart svg vector

Simple infographic dashboard template with flat design graphs and charts - light version

Infographic dashboard template with flat design graphs and charts. Processing and analysis of data clipart svg vector

Infographic dashboard template with flat design graphs and charts. Processing and analysis of data

Infographic dashboard template with flat design graphs and charts. Processing and analysis of data clipart svg vector

Infographic dashboard template with flat design graphs and charts. Processing and analysis of data

Simple Set of Graph Related Vector Line Icons. Contains such Icons as Pie Chart, Graphic, Statistics, Column Chart and more. Editable Stroke. 48x48 Pixel Perfect. clipart svg vector

Simple Set of Graph Related Vector Line Icons. Contains such Icons as Pie Chart, Graphic, Statistics, Column Chart and more. Editable Stroke. 48x48 Pixel Perfect.

Business Data Graph and Charts Flat Icons clipart svg vector

Business Data Graph and Charts Flat Icons

Flat icon design of bar graph clipart svg vector

Flat icon design of bar graph

Infographic icons set on white background clipart svg vector

Infographic icons set on white background

Big data complexity visual representation. Cluster analysis visualization. Advanced analytics. Graphic abstract background. Eps10 clipart svg vector

Big data complexity visual representation. Cluster analysis visualization. Advanced analytics. Graphic abstract background. Eps10

A bar graph with relative frequency depicting histogram clipart svg vector

A bar graph with relative frequency depicting histogram

Data complexity representation. Big data concept visualization. Analytics abstract concept. Graphic background. Vector illustration clipart svg vector

Data complexity representation. Big data concept visualization. Analytics abstract concept. Graphic background. Vector illustration

Competitor analysis illustration with infographics. vector background clipart svg vector

Competitor analysis illustration with infographics. vector background

An infographic showing a pie graph with percentage clipart svg vector

An infographic showing a pie graph with percentage

Infographic icons set on white background clipart svg vector

Infographic icons set on white background

Infographic dashboard template with flat design graphs and charts. eps, jpg clipart svg vector

Infographic dashboard template with flat design graphs and charts. eps, jpg

Data Analytics Flat Icons Pack clipart svg vector

Data Analytics Flat Icons Pack

Business Data Graph and Charts Vector Icons clipart svg vector

Business Data Graph and Charts Vector Icons

Set of statistical graphs  flat icon, vector illustration clipart svg vector

Set of statistical graphs flat icon, vector illustration

Graph UP icon in vector. Logotype clipart svg vector

Graph UP icon in vector. Logotype

Data analysis statistic for big data interpretation detailed outline line icon set clipart svg vector

Data analysis statistic for big data interpretation detailed outline line icon set

Infographic dashboard template with flat design graphs and charts. Processing analysis of data. clipart svg vector

Infographic dashboard template with flat design graphs and charts. Processing analysis of data.

Data Visualization Icon with Editable Stroke. clipart svg vector

Data Visualization Icon with Editable Stroke.

Bar graphs in a chart representing column graph clipart svg vector

Bar graphs in a chart representing column graph

A bar graph with relative frequency depicting histogram clipart svg vector

A bar graph with relative frequency depicting histogram

E-commerce dashboard with pie charts, bar graphs, line graphs, and a percentage indicator. Ideal for online business, data analysis, sales performance, marketing strategy, and technology. Minimalist clipart svg vector

E-commerce dashboard with pie charts, bar graphs, line graphs, and a percentage indicator. Ideal for online business, data analysis, sales performance, marketing strategy, and technology. Minimalist

Big data complexity visual representation. Cluster analysis visualization. Advanced analytics. Graphic abstract background. Eps10 clipart svg vector

Big data complexity visual representation. Cluster analysis visualization. Advanced analytics. Graphic abstract background. Eps10

Curved layers on a graph showing an idea of streamgraph clipart svg vector

Curved layers on a graph showing an idea of streamgraph

Infographic  template with business  graph. Processing analysis of data clipart svg vector

Infographic template with business graph. Processing analysis of data

Infographic dashboard template with flat design graphs and charts eps jpg clipart svg vector

Infographic dashboard template with flat design graphs and charts eps jpg

Big data complexity. Creative data visualization. Advanced analytics. Beauty of global data. Abstract background. Globe of connected nodes. clipart svg vector

Big data complexity. Creative data visualization. Advanced analytics. Beauty of global data. Abstract background. Globe of connected nodes.

Infographic line vector icons and signs. Visual, Diagram, Illustration, Graph, Design, Representation, Information, Data vector outline illustration set clipart svg vector

Infographic line vector icons and signs. Visual, Diagram, Illustration, Graph, Design, Representation, Information, Data vector outline illustration set

Man with graphic on white background clipart svg vector

Man with graphic on white background

Vector big data visualization. Visual information complexity. Data analytics representation. Beauty of data. clipart svg vector

Vector big data visualization. Visual information complexity. Data analytics representation. Beauty of data.

Flat isometric concept illustration. Analytics earn money from video content clipart svg vector

Flat isometric concept illustration. Analytics earn money from video content

Business Data Graph and Charts Glyph Icons clipart svg vector

Business Data Graph and Charts Glyph Icons

Abstract big data visualization concept. Infographics data science design. Cluster analysis. Vector background. clipart svg vector

Abstract big data visualization concept. Infographics data science design. Cluster analysis. Vector background.

Infographic icons set on white background clipart svg vector

Infographic icons set on white background

Wooden stand with analytics graph report - vector illustration clipart svg vector

Wooden stand with analytics graph report - vector illustration

Business data flat icon design, gear graph clipart svg vector

Business data flat icon design, gear graph

Business Data Graph and Charts Icon Pack clipart svg vector

Business Data Graph and Charts Icon Pack

Need a little financial stability after all that Christmas gift giving? Make a design plan with your Colored Financial Vector Icons!  The pack is perfect for all your finance and money projects. clipart svg vector

Need a little financial stability after all that Christmas gift giving? Make a design plan with your Colored Financial Vector Icons! The pack is perfect for all your finance and money projects.

Infographic dashboard template with flat design graphs and charts. Processing and analysis of data. World map and mark on it clipart svg vector

Infographic dashboard template with flat design graphs and charts. Processing and analysis of data. World map and mark on it

Illustration of graph showing product lifecycle and BCG graph clipart svg vector

Illustration of graph showing product lifecycle and BCG graph

Web window with circle chart for business analysis clipart svg vector

Web window with circle chart for business analysis

Infographic icons set on white background clipart svg vector

Infographic icons set on white background

Infographic dashboard template with flat design graphs and charts. Processing and analysis of data clipart svg vector

Infographic dashboard template with flat design graphs and charts. Processing and analysis of data

An infographics with the different graphs clipart svg vector

An infographics with the different graphs

Business Data Graph and Charts Vector Pack clipart svg vector

Business Data Graph and Charts Vector Pack

Volume bars up and down in a icon representing volume analysis clipart svg vector

Volume bars up and down in a icon representing volume analysis

Man with report and graphic clipart svg vector

Man with report and graphic

33 Percentage circle diagrams Infographics vector, circle diagram business illustration, Designing the 33% Segment in the Pie Chart. clipart svg vector

33 Percentage circle diagrams Infographics vector, circle diagram business illustration, Designing the 33% Segment in the Pie Chart.

Data complexity representation. Big data concept visualization. Analytics abstract concept. Graphic background. Information clustering. clipart svg vector

Data complexity representation. Big data concept visualization. Analytics abstract concept. Graphic background. Information clustering.

Radar chart flat icon design clipart svg vector

Radar chart flat icon design

Business Data Graph and Charts Icon Pack clipart svg vector

Business Data Graph and Charts Icon Pack

Two way arrow with infographic depicting modern infographic clipart svg vector

Two way arrow with infographic depicting modern infographic

Infographics on curved  bar graph called modern infographic chart clipart svg vector

Infographics on curved bar graph called modern infographic chart

Data Science filled line Icons clipart svg vector

Data Science filled line Icons

Grab this carefully crafted icon of pie chart, business analysis vector clipart svg vector

Grab this carefully crafted icon of pie chart, business analysis vector

Scatter plot color icon. Scattergram. Mathematical diagram. Symbolic representation of information. Chart on coordinate plane. Statistics data visualization. Isolated vector illustration clipart svg vector

Scatter plot color icon. Scattergram. Mathematical diagram. Symbolic representation of information. Chart on coordinate plane. Statistics data visualization. Isolated vector illustration

Background. Illustration with different association terms. clipart svg vector

Background. Illustration with different association terms.

86 Percentage circle diagrams Infographics vector, circle diagram business illustration, Designing the 86% Segment in the Pie Chart. clipart svg vector

86 Percentage circle diagrams Infographics vector, circle diagram business illustration, Designing the 86% Segment in the Pie Chart.

80 Percentage circle diagrams Infographics vector, circle diagram business illustration, Designing the 80% Segment in the Pie Chart. clipart svg vector

80 Percentage circle diagrams Infographics vector, circle diagram business illustration, Designing the 80% Segment in the Pie Chart.

Sectional round graph representing pie chart clipart svg vector

Sectional round graph representing pie chart

Creative retro round educational infographic background stock vector clipart svg vector

Creative retro round educational infographic background stock vector

Data Science outline Icons clipart svg vector

Data Science outline Icons

Set of circle diagrams for infographics clipart svg vector

Set of circle diagrams for infographics

Business Data Graph and Charts Vector Pack clipart svg vector

Business Data Graph and Charts Vector Pack

Data Science glyph Icons clipart svg vector

Data Science glyph Icons

Positive And negative Number line. Integers on number line. Whole negative and positive numbers, zero. Math chart for addition and subtraction operations in school isolated on white background. Vector clipart svg vector

Positive And negative Number line. Integers on number line. Whole negative and positive numbers, zero. Math chart for addition and subtraction operations in school isolated on white background. Vector

Digital presentation abstract concept vector illustration. Office online meeting, visual data representation, business conference, education, digital marketing, public speaking abstract metaphor. clipart svg vector

Digital presentation abstract concept vector illustration. Office online meeting, visual data representation, business conference, education, digital marketing, public speaking abstract metaphor.

Vector big data visualization. Visual information complexity. Data analytics representation. clipart svg vector

Vector big data visualization. Visual information complexity. Data analytics representation.

Network information background. Connected spherical system. Big data visualization. Social media graph of users. clipart svg vector

Network information background. Connected spherical system. Big data visualization. Social media graph of users.

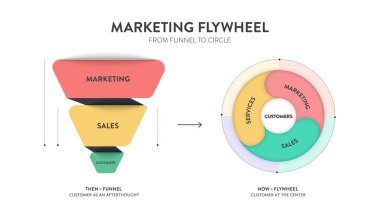
Marketing Flywheel from funnel to circle strategy infographic diagram presentation template has marketing, sales and customers. Funnel is customer as afterthought and flywheel is customer at center. clipart svg vector

Marketing Flywheel from funnel to circle strategy infographic diagram presentation template has marketing, sales and customers. Funnel is customer as afterthought and flywheel is customer at center.

Creative puzzle infographic background stock vector clipart svg vector

Creative puzzle infographic background stock vector

Big data complexity visual representation. Cluster analysis visualization. Advanced analytics. Beauty of data graphic abstract background. clipart svg vector

Big data complexity visual representation. Cluster analysis visualization. Advanced analytics. Beauty of data graphic abstract background.

Infographic icons set on white background clipart svg vector

Infographic icons set on white background

Infographic icons set on white background clipart svg vector

Infographic icons set on white background

Business Data Graph and Charts Vector Icons clipart svg vector

Business Data Graph and Charts Vector Icons

Infographic icons set on white background clipart svg vector

Infographic icons set on white background

Infographic  template with arrow. Processing analysis of data clipart svg vector

Infographic template with arrow. Processing analysis of data

Infographics Page Template. Graphs and Charts. Illustration Vector clipart svg vector

Infographics Page Template. Graphs and Charts. Illustration Vector

Balanced scorecard perspectives, strategy mind map, business concept clipart svg vector

Balanced scorecard perspectives, strategy mind map, business concept

Creative colored info-graphics isolated on white background clipart svg vector

Creative colored info-graphics isolated on white background

Graphic of growth with curves and thick apexes. Visual presentation of progress. Graph to display statistical data isolated vector illustration. clipart svg vector

Graphic of growth with curves and thick apexes. Visual presentation of progress. Graph to display statistical data isolated vector illustration.

Data complexity representation. Big data concept visualization. Analytics abstract concept. Graphic background. Information clustering. clipart svg vector

Data complexity representation. Big data concept visualization. Analytics abstract concept. Graphic background. Information clustering.

Tetrahedral Graph. Sacred Geometry Vector Design Elements. the world of geometric with our intricately illustrations. clipart svg vector

Tetrahedral Graph. Sacred Geometry Vector Design Elements. the world of geometric with our intricately illustrations.

Infographics Page Template. Dashboard, Graphs and Charts. Illustration Vector clipart svg vector

Infographics Page Template. Dashboard, Graphs and Charts. Illustration Vector

Data Graphic Representation Charts Of Different Types Hand Drawn Design Templates In Pencil Monochrome Style. Vector Graphs And Diagrams Set In Black And White Color Pen Illustrations. clipart svg vector

Data Graphic Representation Charts Of Different Types Hand Drawn Design Templates In Pencil Monochrome Style. Vector Graphs And Diagrams Set In Black And White Color Pen Illustrations.
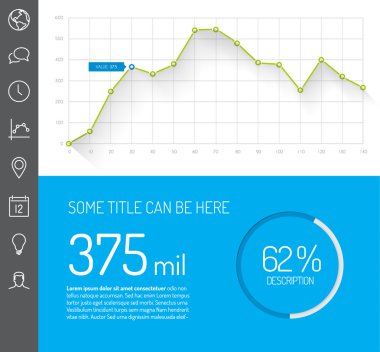
Simple infographic dashboard template with flat design graphs and charts - green and blue version clipart svg vector

Simple infographic dashboard template with flat design graphs and charts - green and blue version

Vector illustration of Simple infographic dashboard template with flat design graphs and charts, orange and blue version clipart svg vector

Vector illustration of Simple infographic dashboard template with flat design graphs and charts, orange and blue version

Infographic dashboard template with graphs and charts clipart svg vector

Infographic dashboard template with graphs and charts

Infographic concept template with flat design graph. vector illustration clipart svg vector

Infographic concept template with flat design graph. vector illustration

Infographic dashboard template with flat design graphs and charts. Processing and analysis of data clipart svg vector

Infographic dashboard template with flat design graphs and charts. Processing and analysis of data

Colorful chart and a red arrow on a white background are shown in the picture. clipart svg vector

Colorful chart and a red arrow on a white background are shown in the picture.

Business analytics doodle vectors pack, consisting all the geometrical data charts in editable style. Use it for your web and commercial projects. clipart svg vector

Business analytics doodle vectors pack, consisting all the geometrical data charts in editable style. Use it for your web and commercial projects.

Infographic concept template with flat design graph. vector illustration clipart svg vector
Infographic concept template with flat design graph. vector illustration

Marketing Flywheel from funnel to circle strategy infographic diagram presentation template has marketing, sales and customers. Funnel is customer as afterthought and flywheel is customer at center. clipart svg vector

Marketing Flywheel from funnel to circle strategy infographic diagram presentation template has marketing, sales and customers. Funnel is customer as afterthought and flywheel is customer at center.

Infographic dashboard template with flat design graphs and charts clipart svg vector

Infographic dashboard template with flat design graphs and charts

Simple set of graph related, pie diagram, bar charts and graphs line icons. Can be widely used for representing data in many areas such as statistics, data science, math, economics, market. 48x48 Pixel perfect icon, editable stroke. Vector. clipart svg vector

Simple set of graph related, pie diagram, bar charts and graphs line icons. Can be widely used for representing data in many areas such as statistics, data science, math, economics, market. 48x48 Pixel perfect icon, editable stroke. Vector.