Synthesizer icon

TV radio tower silhouette vector. Radio repeater isolated set on white background

Simple sine wave drawing. One, two and three period with 3 different width.

Synthesizer icon. Flat design long shadow. Vector illustration

Set of vertical criss-cross wavy zigzag lines, vector, illustration

A picture of a clock showing the time flying on a white background

Education Chart of Physics for Simple Pendulum Diagram. Vector illustration

Abstract Blue wavelengths and irregular lines on a lighter background. Editable Clip Art.

An English Idiom showing a clock flying

Illustration of the square buttons with clocks on a white background

Vector Seamless Reaction Diffusion Set - Mathematical Biology Turing Patterns

Stock market investment trading technical analysis candlestick, bar, line and area chart set. Business candle stick graph exchange trend. Trader financial investment index concept on black background

Set of Doodle Style Experiment Icons

Vector Reaction Diffusion Non-Equilibrium Thermodynamics Design Set - Chemical Kinetics Patterns

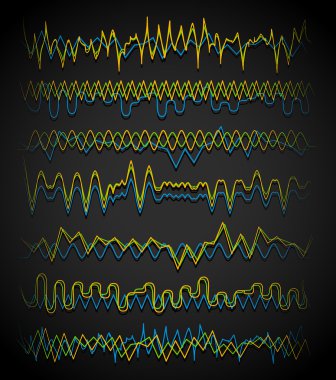
Equalizer (Eq) lines. Wavy, zigzag lines. Frequency, squiggle lines. Vector

Vector green radar with sine wave

Wavy, zig-zag lines, stripes element

Modern dj mixing headphones icon flat style

Electromagnetic wave . Electric and magnetic field, vector

Minimalist background with wave frame

Set of four colourful clocks on a white background

Abstract futuristic technology background of laggard sideway stock and candle stick bar chart graph green and red

Abstract futuristic technology background of fundamental analysis vs technical analysis stock market Price Chart

Vector image of technical analysis - Bollingers indstrips

Home Music Studio Equipment Illustration in flat design style, exposing computer monitor with digital work station,stationary speakers, headphones and midi piano keyboard.

Set of vertical criss-cross wavy zigzag lines, vector, illustration

Schematic diagram of a cyclotron

Set of 30 core essential atomic and quantum physics formulas and equations, ideal for science visuals, educational materials and infographics, transparent background

Analog synthesizer icon. Flat design long shadow. Vector illustration.

Thin Line Icon. Analog Synthesizer. Simple Trendy Modern Style Round Color Vector Illustration.

Illustration of the round icons with clocks on a white background

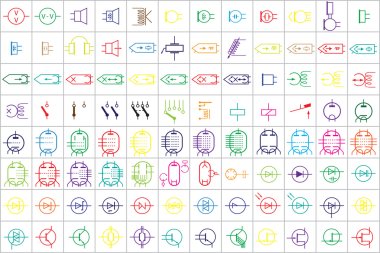
Symbols of electronic components are shown in the picture.

Summer animal

96 Electronic and Electric Symbols Colored Vector Vol.2

Kitchen electric scales icon. Orange background with black. Vector illustration.

Pack of Science and Lab Apparatus Flat Icons

A hand drawn icon of pendulum

Thin Line Icon. Analog Synthesizer. Simple Trendy Modern Style Round Color Vector Illustration.

Abstract background of stock market with macd rsi stochastic strategy and world map

Wavy, zig-zag lines, stripes element

Abstract background of Stock Market bollinger bands indicator technical analysis graph

Stock market investment trading technical analysis candlestick, bar, line and area chart set on white background. Business candle stick graph exchange trends. Trader financial investment index. Vector

Japanese candlesticks consist of connected dots, lines on dark gray background. Stock market and investment concepts. Low poly wireframe vector illustration with 3D effect.

Abstract background of MACD indicator technical analysis graph

Clock showing the eleventh hour on a white background

Macd Moving Average Convergence Divergence indicator for stock market trading with big screen and candle stick with modern flat style vector illustration

Wavy, zig-zag lines, stripes element

Vector illustration design of Kitchen electric scales icon isolated on white background

Abstract futuristic technology background of stock market and candle stick bar chart graph green and red

A doodle style icon of a pendulum

Analyzing Stock Trend, Studying market movement for investments

Simple cosine of x function graph. Wave with one, two and three periods, 3 stroke weight versions.

LC Oscillator Circuit, Electrical Circuit

Kitchen Electric Scales Icon. Flat Color Design. Vector Illustration.

Bollinger band technical analysis indicator concept on laptop screen with candlestick with modern flat style vector illustration

LC Oscillator Circuit, Electrical Circuit

Wavy, zig-zag lines, stripes element

Frequency wavelength logo vector

Abstract background of stock market candlestick graph with Economic Indicators table

Abstract background of trading stock market MACD indicator technical analysis graph, Moving Average Convergence Divergence

An outline icon of pendulum movement

Line style icon of pendulum movement

Oscillation Simple vector icon. Illustration symbol design template for web mobile UI element. Perfect color modern pictogram on editable stroke. Oscillation icons for your business project

Abstract background of MACD indicator technical analysis graph

Illustration of a young girl with an alarm clock on a white background

Abstract Lines flowing in a green space

Colourful icons with wall clocks on a white background

Set of vertical criss-cross wavy zigzag lines, vector, illustration

Abstract background of trading stock market EMA indicator technical analysis graph with stock market volume chart

Equalizer (Eq) lines. Wavy, zigzag lines. Frequency, squiggle lines. Vector

Cool artwork concept of audio or sound engineering for music artists, DJ or online service subscriptions

Abstract background of Thailand Stock Market (SET50) and MACD indicator technical analysis graph

Illustration of a digital weighing scale on a white background