
Three part cycle diagram on white background

Colorful vector diagram with many sectors.Modern infographic

Radial diagram design template. Vector

Radial diagram design template. Vector

Migrant bird infographic. Bird and radial diagram. Design element. Flat design

Intelligence infographics. Monkey or ape and radial diagram. Design element. Flat design

6 part arrow wheel diagram illustration isolated on white background

Cycle process diagrams set, vector illustration

Blue polar coordinate circular grid graph paper, graduated every 1 degree, numbered every 10 degrees in both directions

Vector green polar coordinate circular grid graph paper, graduated every 1 degree, numbered every 10 degrees in both directions
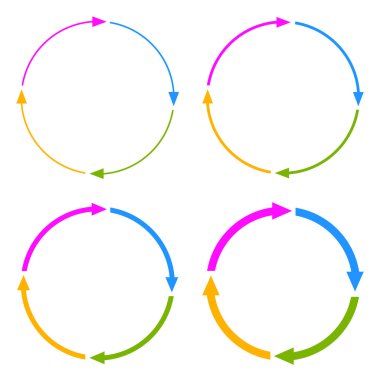
Four segments arrow circle on white background

Blue polar coordinate circular grid graph paper, graduated every 1 degree. Can be used for creating geometric patterns, drawing mandalas or sketching circular logos

Blue vector polar coordinate circular grid graph paper background, graduated every 1 degree

Collection of circle diagrams with 4 to 9 petals
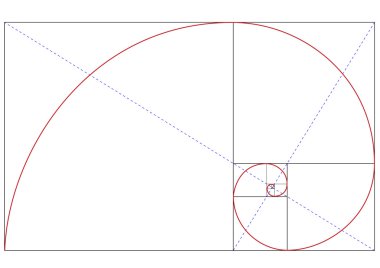
Fibonacci golden ratio for design harmony, vector

Color wheel chart. Multicolored gradient hues. Circular spectrum vector. Abstract geometric design. EPS 10.

Isometric business infographic template. 3d neon gradient pie chart icon, creative concept for documents layout, reports, presentations, infographics, web design, apps. Vector illustration

Polar, circular grid, mesh. Pie chart, graph element

Polar, circular grid, mesh. Pie chart, graph element

Isometric business pie chart set. 3D financial, statistical and marketing data visualization tools. Colourful round diagram template. Vector Illustration elements for web site, presentation, apps

Presentation Template design. Business data graphs. Vector financial and marketing charts.

Business infographics. Diagram for presentation. Vector template.
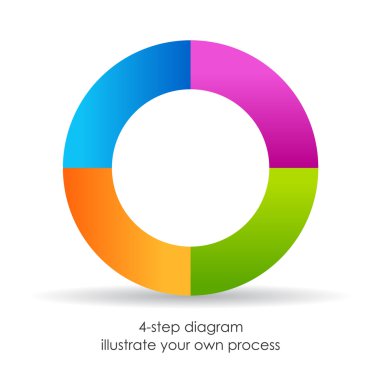
4 step cycle diagram isolated on white background

Corporate Infographic Elements is an excellent collection of vector graphs, charts and diagrams.

Polar, circular grid, mesh. Pie chart, graph element

Presentation Template design. Business data graphs. Vector financial and marketing charts.

Four segments cycle diagram on white background

Digital circle equalizer. Orange technology background with lines and waveforms. Glowing circle frame. Easy to recolor. Eps10 vector

Infographics - statistic elements and icons

Process chat design

Corporate Infographic Elements is an excellent collection of vector graphs, charts and diagrams.

Corporate Infographic Elements is an excellent collection of vector graphs, charts and diagrams.

Polar, circular grid, mesh. Pie chart, graph element

Linear infographics set. Diagrams with 3 4 5 6 7 8 steps. Vector templates.
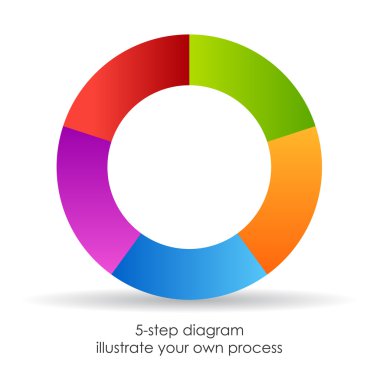
5 step vector diagram isolated on white background

Three 3 parts round flow puzzles diagram vector illustration isolated on white background, abstract design element

Corporate Infographic Elements is an excellent collection of vector graphs, charts and diagrams.

The Sacred Geometry Symbols stroke line didn't Expand yet. It's will be comfortable for you to edit when use.

Lifecycle 3 part diagram isolated on white background

Cycle diagram plan do check act vector illustration isolated on white background

The Sacred Geometry Symbols stroke line didn't Expand yet. It's will be comfortable for you to edit when use.

Corporate Infographic Elements is an excellent collection of vector graphs, charts and diagrams.
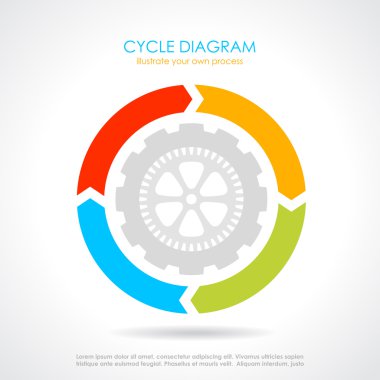
Vector cycle diagram illustration

Corporate Infographic Elements is an excellent collection of vector graphs, charts and diagrams.
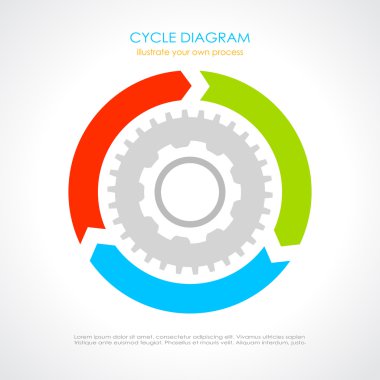
Three part cycle diagram
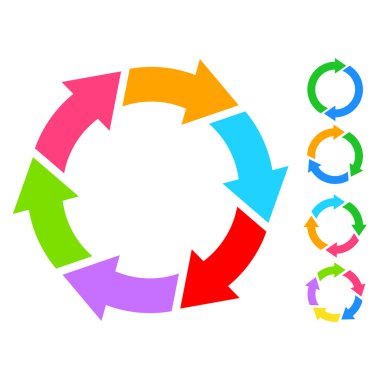
Cycle circle diagrams set

Abstract isometric infographics template. 3D gradient business, financial, marketing data graphs, pie chart and diagram set showing progress and regression on dark background. Vector Illustration

Graphs, bold line icons. The illustrations are a vector, editable stroke, 48x48 pixel perfect files. Crafted with precision and eye for quality.

Process gears diagram isolated on white background
Statistics 01 related, pixel perfect, editable stroke, up scalable, line, vector bloop icon set.

Process relationship diagram isolated on white background

Four-step cycle diagram, vector illustration

Process vector diagram on white background

Elements for infographics. Pie charts, diagrams with 2 3 4 5 6 7 8 9 10 parts Vector design templates

Business isometric infographic elements

Loading progress or status bar vector icons of HUD user interface design. Futuristic digital interface of head up display with circular bars of download process, data upload, loader percentage diagram

Golden ratio, geometric fibonacci formula, vector background

Four parts diagrams set

Big set of nfographic elements

Big set of nfographic elements, graphs, charts and diagrams

Infographic elements for business layout, presentation template, flyer, leaflet and corporate report. UI and UX Kit with big data visualization.

Radial diagram. Element of presentation, diagram, chart. Concept for business templates, infographics, marketing, reports. Can be used for topics like marketing, business data, analysis, statistics

Circular arrows sign. Vector. Colorful icon with bright texture of mosaic with soft shadow on white background. Isolated.

Abstract 3D infographic template with a 6 steps for success. Business circle template with options for brochure, diagram, workflow, timeline, web design.

Five part cycle diagrams set

Vector infographic circle. Vector illustration can be used for workflow layout, diagram, number options, web design.

Three zones diagram. Element of presentation, segmented diagram, step chart. Concept for business infographics, templates, reports. Can be used for topics like strategy, analysis, planning

Presentation Template design. Business data graphs. Vector financial and marketing charts.

Infographics step by step with radial structure. Flat icon.
Hexagon six part diagram on white background

Business data visualization. Abstract elements of graph, diagram with 5 steps, options, parts or processes. Vector business template for presentation. Creative concept for infographic.

Set of multicolored infographic elements

Vector color flat chart diagram icon illustration set. Red and blue diagram collection of pie, donut, radial bar and polar area infographic element. Design for finance, statistics, analitics, science.

Abstract Circle Infographics Design Template

Abstract isometric infographics template. 3D business, financial, marketing data graphs and diagram set showing progress and regression. Colourful graphics, pie chart, world map. Vector Illustration

Bussines Presentation Template design. Data graphs. Vector financial and marketing charts.

Presentation Template design. Business data graphs. Vector financial and marketing charts.

Radial infographic design vector template

Business isometric infographic elements

Corporate Infographic Elements is an excellent collection of vector graphs, charts and diagrams.

Business isometric infographic elements

Corporate Infographic Elements is an excellent collection of vector graphs, charts and diagrams.

Business diagram set. Editable templates for radial diagram, speedometer chart and timeline diagram

Presentation Template design. Business data graphs. Vector financial and marketing charts.

Circle segment set. Set of pie charts

Infographic elements data visualization vector design template. Can be used for steps, options, business processes, workflow, diagram, flowchart concept, timeline, marketing icons, info graphics.

Linear infographics set. Diagrams with 3 4 5 6 7 8 steps. Vector templates.

Presentation Template design. Business data graphs. Vector financial and marketing charts.

Cycle diagram vector design

Business isometric infographic elements

Vector illustration of a circle of seven infographics.

Circle frame, with meander made of a Celtic double spiral pattern. Decorative round border, made of alternate flipped double spirals, rotating around a midpoint, shaping a repeated motif. Illustration

Orange paper cut background. Abstract realistic papercut decoration with radial layers. Vector 3d illustration. Cover layout template. Material design concept

Abstract Colorful Circular Infographics Design Concept with Radial Labels and Icons - Illustration in Freely Scalable and Editable Vector Format

Abstract Circle Infographics Design Template

Chart and graph color icons set. Pie diagram. Horizontal and vertical histogram. Area chart. Venn diagram. Pareto curve. Temperature map. Polar watch. Scatter chart. Isolated vector illustrations

Corporate Infographic Elements is an excellent collection of vector graphs, charts and diagrams.

Chart and graph color icons set. Horizontal histogram. Area chart with segments. Function curve. Radial diagram. Pareto curve. Figure chart. Data connection and wiring. Isolated vector illustrations

Corporate Infographic Elements is an excellent collection of vector graphs, charts and diagrams.

Business and freelance hand drawn infographic elements with orange pencil