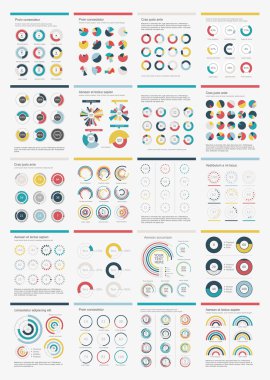
Infographic Elements.Big chart set icon.

45 percent pie chart. Doughnut or donut type graph. Statistical tool represents share of the total. 3D vector illustration.

Vector set of infographic elements containing population demographics design, business statistical line graphs with icons, 3d column, pie, shape bar and ring charts, isolated forms on white background

85 percent pie chart. Doughnut or donut type graph. Statistical tool represents share of the total. 3D vector illustration.

80 percent pie chart. Doughnut or donut type graph. Statistical tool represents share of the total. 3D vector illustration.

70 percent pie chart. Doughnut or donut type graph. Statistical tool represents share of the total. 3D vector illustration.

70 percent pie chart. Doughnut or donut type graph. Statistical tool represents share of the total. 3D vector illustration.

Colorful Abstract Modern Numbered Network Infographics Cover or Chart Creative Design Template with Icons - Illustration in Freely Editable Vector Format

Percentage diagram. Infographic design template with icons. Vector illustration

Vector infographics set, ring diagrams from 1 to 100 percent, more charts, world map, elements for your business presentation

Set of charts and graphs for reports and statistics

Illustration of info graphic business concept in isometric 3d graphic

Presentation template for infographics with pie chart diagram. Web elements.
Three-dimensional pie charts and file icons

Set of charts and graphs for reports and statistics

Vector infographics set, ring diagrams from 1 to 100 percent, more charts, world map, transport icons, elements for your business presentation
Set of rainbow charts
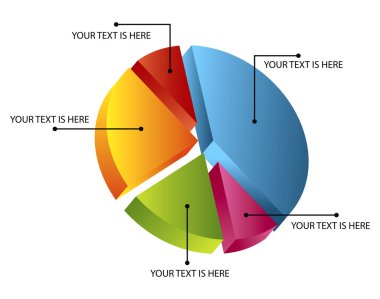
3d pie chart

Fashion infographics set with male and female clothes underwear and accessories vector illustration

3d isometric pie charts icon vector illustration

Percentage Diagram Presentation Design Elements. Vector illustration.

Segmented and multicolored pie charts and arrows set with 3, 4, 5, 6, 7 and 8 divisions. Template for diagram, graph, presentation and chart.

Set of charts and graphs for reports and statistics

Set of charts and graphs for reports and statistics

Set of charts and graphs for reports and statistics

Set of charts and graphs for reports and statistics

Set of charts and graphs for reports and statistics

Set of charts and graphs for reports and statistics

Set of charts and graphs for reports and statistics

Presentation template for infographics with pie chart diagram. Web elements.

Set of bulk isometric pie charts. Templates realistic three-dimensional pie charts. Business data, colorful elements for infographics. Vector illustration

Presentation template circle graph with a 3d glass balls. Pie chart diagram. Infographics web elements.

Set of pie charts and graphs. Flat design

Set of charts and graphs for reports and statistics

3d pie chart

Set of charts and graphs for reports and statistics

Set of bulk isometric pie charts. Templates realistic three-dimensional pie charts. Business data, colorful elements for infographics. Vector illustration
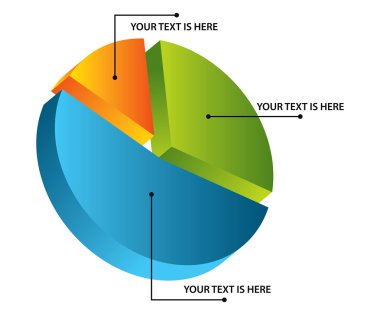
3d pie chart

Set of three-dimensional objects, colorful elements of infographics for business. Isometric diagrams, graphs, icons, pyramid, pie charts. Vector illustration

Set of different pie charts. Modern infographics for presentations.

3d pie chart

Set of pie charts with transition in arrow form, displacement of contour and halftone shadow. Colorful elements for infographics. Vector illustration

Vector black people search icons set

Illustration of info graphic business concept in isometric 3d graphic

Presentation template circle graph with a 3d glass balls. Pie chart diagram. Infographics web elements.

Isometric infographics set with colored circular ring bar line charts and world map with mark. 3d flat graph in isometric style

Business Infographic icons - Vector Graphics. Sets

Set of charts and graphs for reports and statistics

Jewelry infographic with diamonds charts and jewellery icons set vector illustration

Set of colored pie charts with rounded forms. Templates sectoral charts. Colorful elements for infographics. Vector illustration

Fully editable EPS 10 Vector Format

Percentage Diagram Presentation Design Elements. Infographics. Vector illustration.
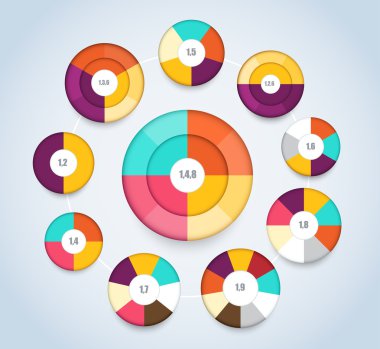
Multi level pie chart template for presentation. vector illustration.

3D diagram with space to add text

Modern design circle template for infographics. 3D.

Collection Of Diagrams, Charts and Globe - Vector Illustration

Percentage Diagram Presentation Design Elements. Vector illustration

EPS10 Dark Diagrams and Charts - Vector Design

Business Diagram Template with arrows, four segments and text fields

Percentage Diagram Presentation Design Elements. Infographics. Vector illustration

Illustration of info graphic business concept in isometric 3d graphic

Percentage Diagram Presentation Design Elements. Infographics. Vector illustration.

Illustration of info graphic business concept in isometric 3d graphic

Illustration of info graphic business concept in isometric 3d graphic

Illustration of info graphic business concept in isometric 3d graphic
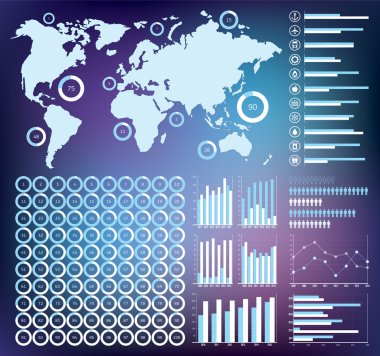
Vector infographics set, ring diagrams from 1 to 100 percent, more charts, world map, transport icons, elements for your business presentation, dark version

Vector illustration of hand drawn hatched pie charts with different percentage division. Vintage style.

Circle multicolor graph

Illustration of info graphic business concept in isometric 3d graphic

Illustration of info graphic business concept in isometric 3d graphic

Top view of the office desk with objects, book of procrastination, open diary and ringing phone. Hands holding the tablet point to a screen with the Eisenhower Matrix.

Illustration of info graphic business concept in isometric 3d graphic

Financial currency exchange. Graphs and charts. Stock vector illustration.

Percentage Diagram Presentation Design Elements. Vector illustration

Illustration of info graphic business concept in isometric 3d graphic

Set of bulk green isometric pie charts with separated segments. Templates sectoral graphs. Elements of infographics for business. Vector illustration

Percentage Diagram Presentation. Infographic design template. Vector illustration

Set of circular arrows icons. Vector illustration
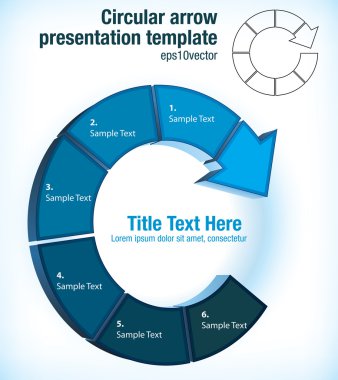
Circular arrow pictogram flow chart presentation template with six individual partitions for text

Pie charts and circular graph infographic kit

Abstract 3D metallic circles blank diagram isolated on white background.

Illustration of info graphic business concept in isometric 3d graphic

Wedding ceremony average cost for urban and country weddings infographic presentation with pictograms diagrams layout vector illustration

Vector pie chart infographic design template.

Illustration of info graphic business concept in isometric 3d graphic

Illustration of info graphic business concept in isometric 3d graphic

Round infographic elements and pie charts

Manila folder with financial report with charts. Ring binder full of business papers. Auditing, tax process, accounting voncept. Vector illustration in flat style

New set of circular charts can use like modern design elements

Work flow chart

Percentage Diagram Presentation Design Elements. Vector illustration

Vector Nine Office and Business icons. Help for designers and web-designers

Vector pie chart infographic design template.

Illustration of info graphic business concept in isometric 3d graphic

Vector colorful arrows circle

New set of different styles circular charts can use like modern design elements

Business data pie charts graphs. Wedding dress icon. Bride and groom rings symbol. Wedding or engagement day ring with diamond sign. Will you marry me speech bubble. Market report presentation. Vector

Set of financial icons. Bars, graph, chart, infographic, diagram elements

Business Diagram Template with arrows, five segments and title buttons

Illustration of info graphic business concept in isometric 3d graphic