
Vector colored numbered charts

Info graphic elements, web technology icons. vector time line diagram, arrow symbol. world map, pie chart icon. financial statistic and marketing report presentation. business banner design
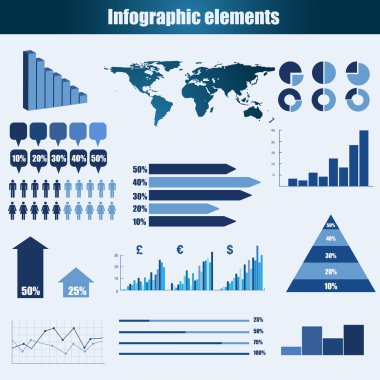
Business infographic elements vector illustration

Infographic elements, web technology icons. vector timeline option graph, reminder calendar sign. pie chart info graphic icon. financial statistic and marketing report presentation banner design
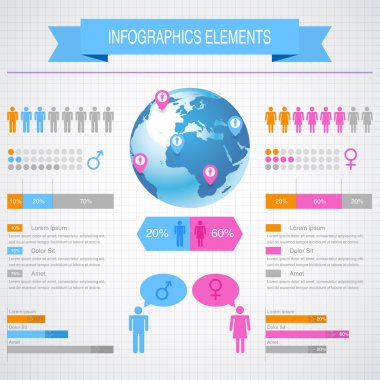
Business infographic elements vector illustration

Infographic elements, internet technology icons. vector time line diagram, spreadsheet. pie chart info graphic tools. financial statistic and business growth report presentation banners design

Business infographic elements vector illustration

Infographic elements, web technology icons. vector timeline option graph, reminder, clock symbol. pie chart info graphic icon. financial statistic and marketing report presentation banner design
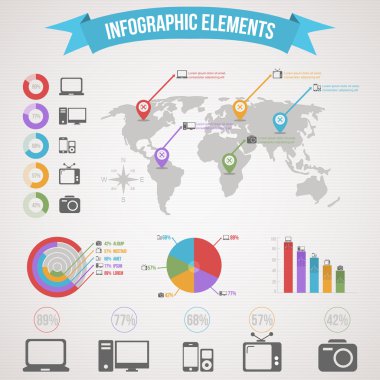
Business infographic elements vector illustration

Info graphic elements, web technology icons. vector time line diagram, arrow symbol. world map, pie chart icon. financial statistic and marketing report presentation. business banner template
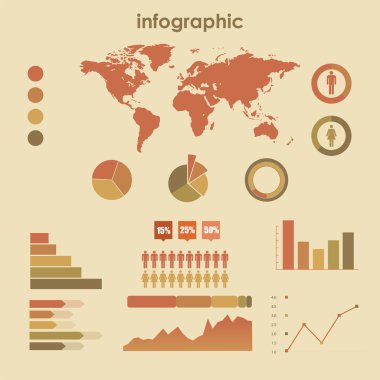
Business infographic elements vector illustration

Set of infographic elements, web technology icons. vector timeline, option graph, bar code symbol. pie chart info graphic icon. financial statistic and marketing report presentation banner design
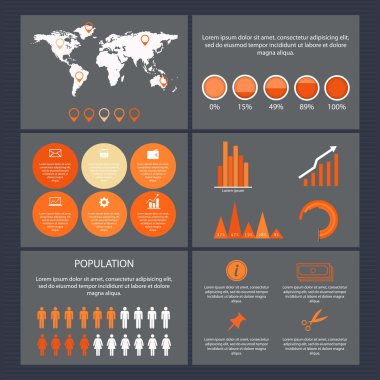
Business infographic elements vector illustration

Infographic elements, web technology icons. vector timeline option graph, reminder, clock symbol. pie chart info graphic icon. financial statistic and marketing report presentation banner design
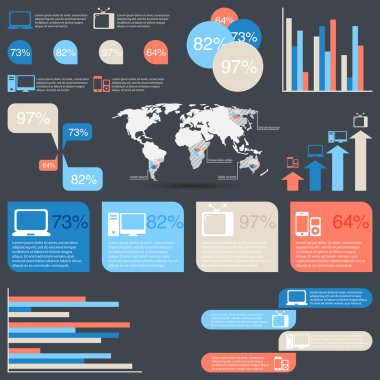
Business infographic elements vector illustration

Set of infographic elements, web technology icons. vector timeline, option graph, bar code symbol. pie chart info graphic icon. economy statistic and financial growth report presentation banner

Business infographic elements vector illustration

Set of infographic elements, web technology icons. vector timeline, option graph, bar code symbol. pie chart info graphic icon. economy statistic and financial growth report presentation banner
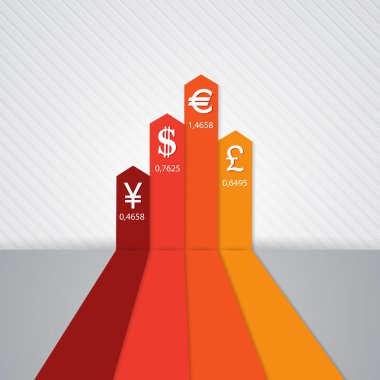
Minimal infographics design. Vector

Infographic elements, web technology icons. vector timeline option graph, reminder bar code symbol. pie chart info graphic icon. financial statistic and marketing report presentation banner design

Business infographic elements, vector illustration

Infographic elements, technology website icons. vector time line diagram, social media timetable, pie chart tools, blurred background. financial statistic and marketing report presentation banner template
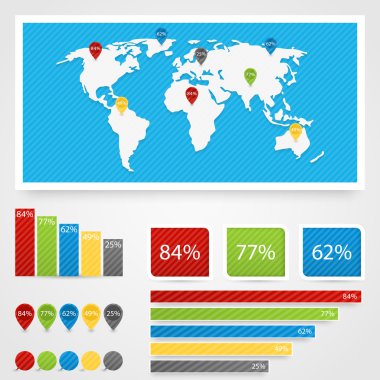
Business infographic elements vector illustration

United Kingdom withdrawal from the European Union info graphics. vector EU and British flags icons, voting result chart. public referendum announcement, political crisis concept. infographic elements
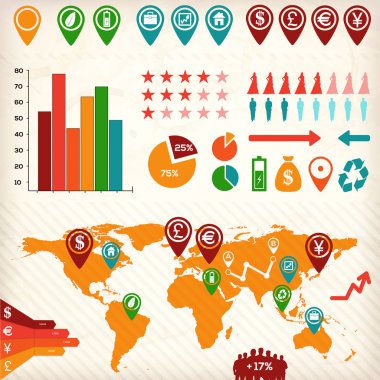
Business infographic elements vector illustration

Infographic elements, schoolroom objects. vector time line graph, work space interior, chalkboard, books icons. education statistic and learning report. school presentation banner design

Business infographic elements vector illustration

Business line chart graph survey results vector illustration image material white background
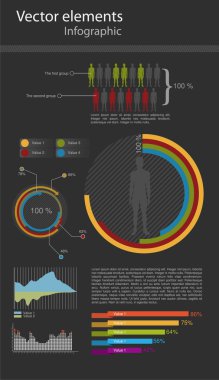
Vector infographic elements for the web and print usage

Creative idea floating color panels
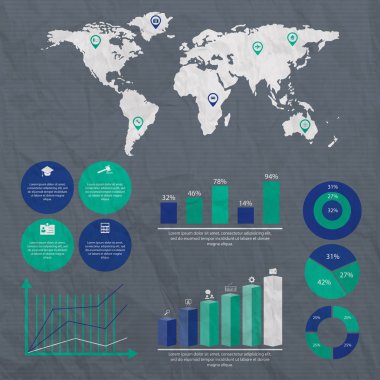
Business infographic elements vector illustration

Polygonal circle chart infographic template with 7 parts, options, steps for presentations, advertising, layouts, annual reports. Vector illustration.

Business infographic elements vector illustration

Illustration Vector of 67 percent blue color in white background
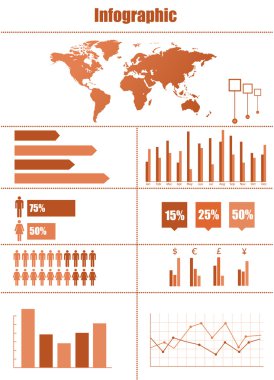
Business infographic elements vector illustration

Business line chart graph survey results vector illustration image material black background

Vector set of infographic elements

Polygonal circle chart infographic template with 11 parts, options, steps for presentations, advertising, layouts, annual reports. Vector illustration.
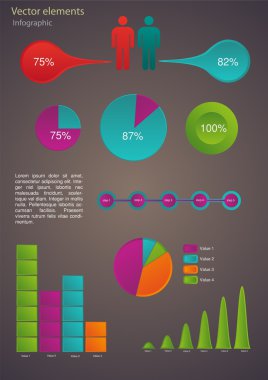
Business infographic elements, vector illustration

Business bar chart graph survey results vector illustration image material black background

Set elements of infographic

Polygonal circle chart infographic template with 12 parts, options, steps for presentations, advertising, layouts, annual reports. Vector illustration.

Business infographic elements vector illustration

Business candle stick graph chart of stock market investment trading with world map. Stock market and exchange. Stock market data. Trend of graph. Vector illustration for your design.
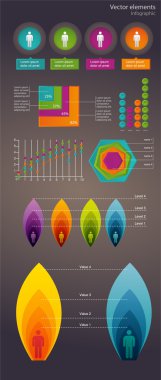
Business infographic elements, vector illustration

Business bar chart graph survey results vector illustration image material white background

Vector set of infographic elements

Illustration Vector of 61 percent blue color in white background
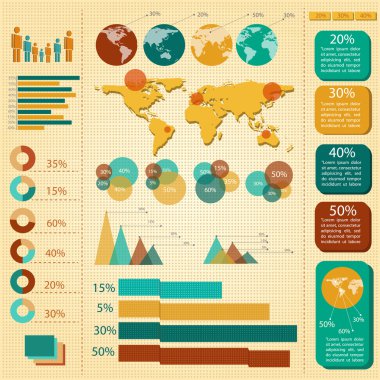
Business infographic elements vector illustration

Illustration Vector of 23 percent blue color in white background

Business infographic elements vector illustration

Illustration Vector of 12 percent blue color in white background
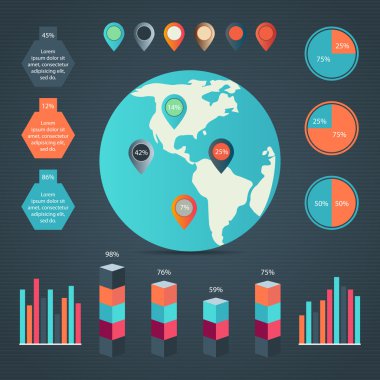
Business infographic elements, vector illustration

Business candle stick graph chart of stock market investment trading with world map. Stock market and exchange. Stock market data. Trend of graph. Vector illustration for your design.

Business infographic elements, vector illustration

Infographic chart. Timeline graph elements with flow diagrams and percent line bars, business process graph. Vector presentation flowchart set
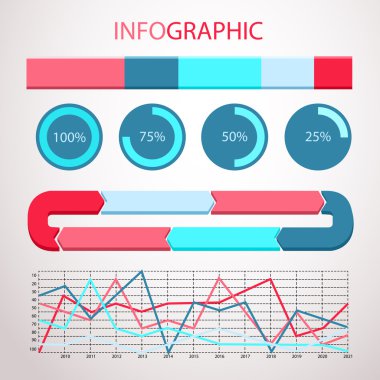
Business infographic elements vector illustration

Vector circle chart infographic templates with 5 6 7 8 9 10 parts, processes, steps
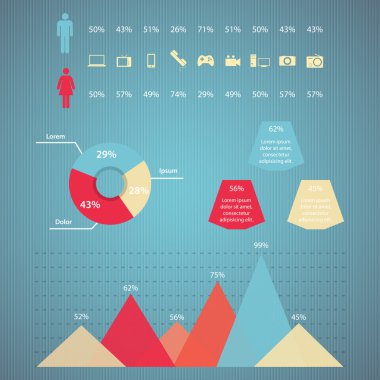
Business infographic elements, vector illustration

Illustration Vector of 69 percent blue color in white background

Business infographic elements vector illustration

Illustration Vector of 22 percent blue color in white background
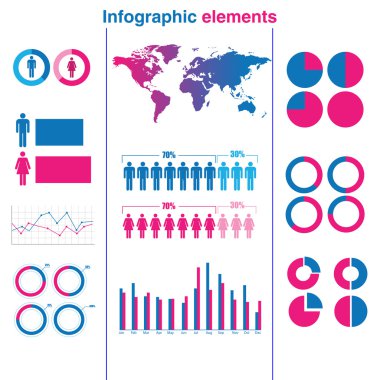
Business infographic elements vector illustration

Creative business info-graphics data presentation design concept vector
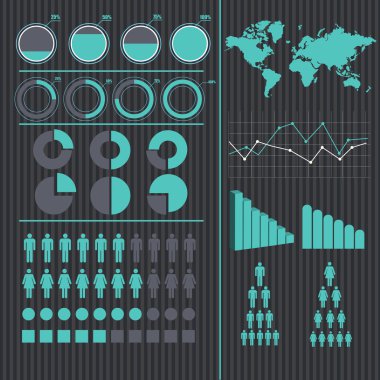
Business infographic elements vector illustration

Minimal infographics design. Vector

Business infographic elements, vector illustration

Business line chart graph survey results vector illustration image material white background

Business infographic elements vector illustration

Set of flat infographic elements vector design template. Can be used for workflow layout, report, business number options, timeline, steps or processes, teamwork, cycle diagram, chart, web design. EPS10
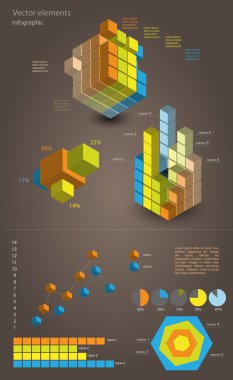
Set elements of infographic

Business and shopping infographics template. Vector.
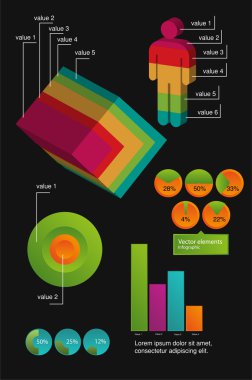
Business infographic elements, vector illustration

Set of infographic elements data visualization vector design template. Can be used for steps, options, business process, workflow, diagram, flowchart concept, timeline, marketing icons, info graphics.
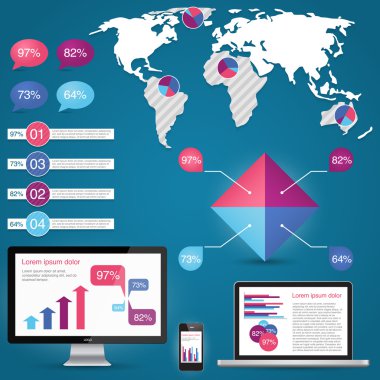
Business infographic elements vector illustration

Set of Timeline Infographic Design Templates.
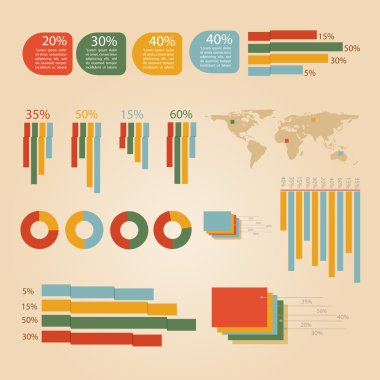
Business infographic elements, vector illustration

Big set of charst, graphs. Blue color. Infographics business elements.
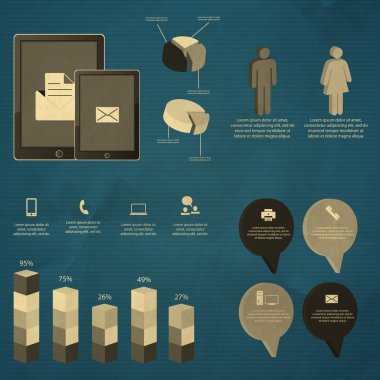
Business infographic elements vector illustration

Infographic elements data visualization vector design template. Can be used for steps, options, business processes, workflow, diagram, flowchart concept, timeline, marketing icons, info graphics.
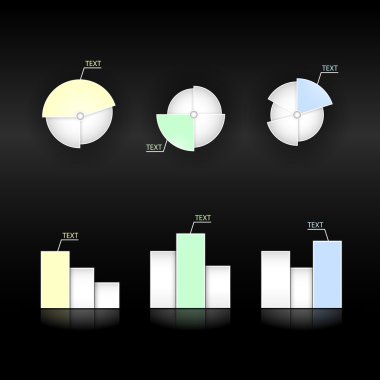
Set of vector diagram and pie charts

Pie chart business finance report item infographics

Business infographic elements vector illustration

Big set of infographics elements. EPS10. Infographic for brochure, web banner

Business infographic elements vector illustration

Pie diagram with parts and explanation percents vector. Flow Charts and charts with lines and numbers, figures numerical statistics data infocharts
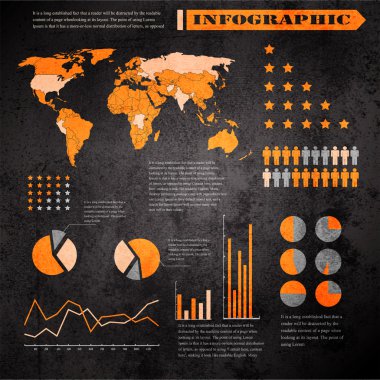
Business infographic elements vector illustration

Infographics report on data received in research vector. Business information organized in flowcharts and infographs. Presentation of pie diagrams

Business infographic elements vector illustration

Tablet screen with 3d graph and a paper with statistic charts

Elegant card vector illustration

Blue Flat chart, graph. Simply color editable. Infographics elements.

Business infographic elements vector illustration

Business graph and green arrow icon. Vector

Set elements of infographic

Set elements of infographics. Info bars, graphycs

Business infographic elements, vector illustration

Decreasing Graph Bar Chart Economic Pressure Financial Problem Statistical Infographic

Business infographic elements vector illustration

Set elements of infographics. Info bars, graphycs