
Maps show long-term effects of global warming such as rising sea levels due to thermal expansion and melting of glaciers and ice sheets.

Abstract background with topographic terrain map. Digital heat landscape with mountains or clouds made of line grid in futuristic technology or science style

Energy industry and ecology of Iran vector map with power stations infographic.

Football or soccer field with heat map. Map of location players during the game. Tactical and strategy football background. Sport background.

Gulf Stream chart. Warm surface and cold subsurface flow in the Atlantic Ocean between North and South America, Africa, Europe and Greenland. Red thermal surface and blue cooled deep-water currents.

Thermal map abstract gradient cold and warm color background with infrared blurred pattern. Retro faded acid neon social media poster, stories highlight templates for digital marketing for stories.

Seamless pattern with abstract rainbow vector heatmap of hot and cold distribution. Heat map. Abstract infrared thermographic background
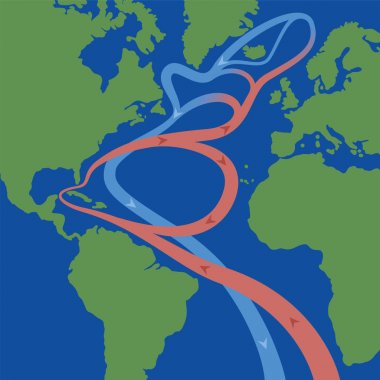
Gulf stream and North atlantic current that cause weather phenomena like hurricanes and is influential on the worlds climate. Flows of red thermal surface currents and blue cooled deep-water currents.

Gulf stream in atlantic ocean. Circular flows of red warm surface currents and blue cool deep-water currents that cause weather phenomena like hurricanes and is influential on the worlds climate.

Hyperthermia and hypothermia health care infographic. Vector flat healthcare illustration. Body cooling infrared heat map isolated on white background.

Energy industry and ecology of Ecuador vector map with power stations infographic.

Energy industry and ecology of Peru vector map with power stations infographic.
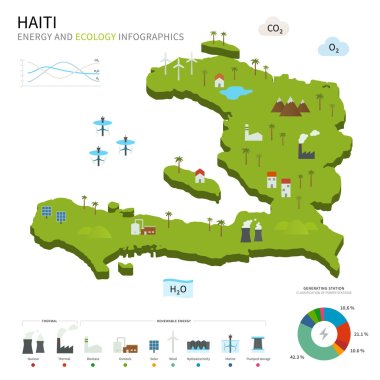
Energy industry and ecology of Haiti vector map with power stations infographic.

Landmarks map of Austria. Sightseeing in Vienna, Salzburg, Solden, Tyrol, Melk. Opera and St. Stephen cathedral, strudel, skiing, church olympic games Abbey Hochosterwitz castle Architecture theme

Energy industry and ecology of Paraguay vector map with power stations infographic.

Energy industry and ecology of Uruguay vector map with power stations infographic.

Energy industry and ecology of Sweden vector map with power stations infographic.

Energy industry and ecology of Madagascar vector map with power stations infographic.

Energy industry and ecology of Oman vector map with power stations infographic.

Energy industry and ecology of Lithuania vector map with power stations infographic.

Energy industry and ecology of Qatar vector map with power stations infographic.

Energy industry and ecology of Kuwait vector map with power stations infographic.

Energy industry and ecology of Norfolk Island vector map with power stations infographic.

Energy industry and ecology of Azerbaijan vector map with power stations infographic.

Energy industry and ecology of Kazakhstan vector map with power stations infographic.

Energy industry and ecology of Botswana vector map with power stations infographic.
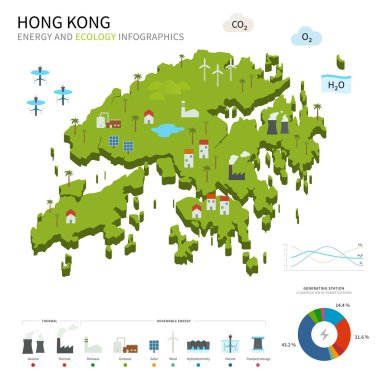
Energy industry and ecology of Hong Kong vector map with power stations infographic.

Energy industry and ecology map Federation of Bosnia and Herzegovina with power stations infographic.

Energy industry and ecology of Vietnam vector map with power stations infographic.

Energy industry and ecology of Europe vector map with power stations infographic.
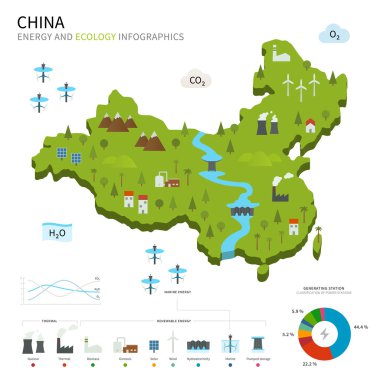
Energy industry and ecology of China vector map with power stations infographic.

Energy industry and ecology of Austria vector map with power stations infographic.

Energy industry and ecology of Nigeria vector map with power stations infographic.

Energy industry and ecology of New Zealand vector map with power stations infographic.

Energy industry and ecology of Nicaragua vector map with power stations infographic.

Energy industry and ecology of Ukraine vector map with power stations infographic.

Energy industry and ecology of Jamaica vector map with power stations infographic.

Energy industry and ecology of Armenia vector map with power stations infographic.

Energy industry and ecology of Australia vector map with power stations infographic.

Energy industry and ecology of Andorra vector map with power stations infographic.

Energy industry and ecology of Georgia vector map with power stations infographic.

Energy industry and ecology of Czech Republic vector map with power stations infographic.

Energy industry and ecology of Sudan vector map with power stations infographic.

Energy industry and ecology of Serbia vector map with power stations infographic.

Energy industry and ecology of Belarus vector map with power stations infographic.

Energy industry and ecology of Brazil vector map with power stations infographic.

Energy industry and ecology of Saudi Arabia vector map with power stations infographic.

Vector graphic of infrared rays with hot spots spectrum on transparent background.

Energy industry and ecology of Philippines vector map with power stations infographic.

Energy industry and ecology of Spain vector map with power stations infographic.
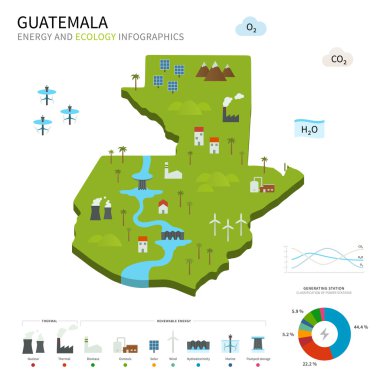
Energy industry and ecology of Guatemala vector map with power stations infographic.

Energy industry and ecology of US Virgin Islands vector map with power stations infographic.

Energy industry and ecology of Mongolia vector map with power stations infographic.

Energy industry and ecology of Ireland vector map with power stations infographic.

Energy industry and ecology of Montenegro vector map with power stations infographic.

Energy industry and ecology vector map with power stations infographic.

Energy industry and ecology of Guinea vector map with power stations infographic.
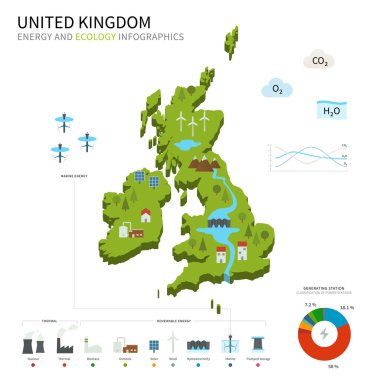
Energy industry and ecology of United Kingdom vector map with power stations infographic.

Energy industry and ecology of Brunei vector map with power stations infographic.

Energy industry and ecology of Netherlands vector map with power stations infographic.

Energy industry and ecology of India vector map with power stations infographic.
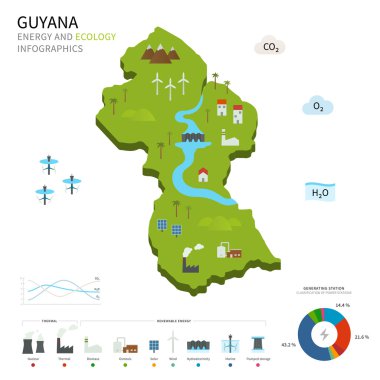
Energy industry and ecology of Guyana vector map with power stations infographic.

Energy industry and ecology of Israel vector map with power stations infographic.
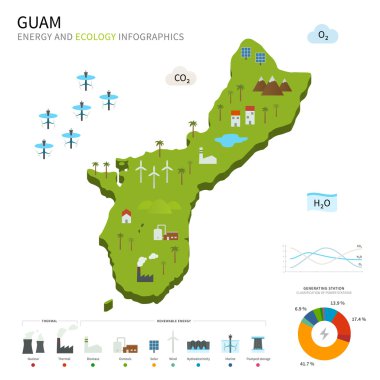
Energy industry and ecology of Guam vector map with power stations infographic.

Energy industry and ecology of Burma vector map with power stations infographic.

Energy industry and ecology of France vector map with power stations infographic.

Energy industry and ecology of Uganda vector map with power stations infographic.

Fuel and energy industry infographic, set elements for creating your own infographics. Vector illustration

Energy industry and ecology of United States vector map with power stations infographic.
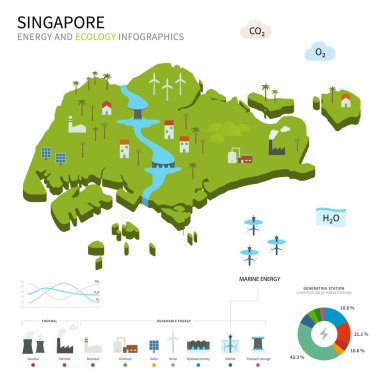
Energy industry and ecology of Singapore vector map with power stations infographic.

Energy industry and ecology of Slovenia vector map with power stations infographic.

Energy industry and ecology of Malaysia vector map with power stations infographic.

Energy industry and ecology of Bangladesh vector map with power stations infographic.

Energy industry and ecology of Sierra Leone vector map with power stations infographic.

Energy industry and ecology of Russia vector map with power stations infographic.

Energy industry and ecology of Thailand vector map with power stations infographic.

Energy industry and ecology of Colombia vector map with power stations infographic.

Energy industry and ecology of Malta vector map with power stations infographic.

Energy industry and ecology of Cyprus vector map with power stations infographic.

Energy industry and ecology of South Korea vector map with power stations infographic.

Energy industry and ecology of Cambodia vector map with power stations infographic.

Energy industry and ecology of El Salvador vector map with power stations infographic.

Energy industry and ecology of Tajikistan vector map with power stations infographic.

Fuel and energy industry infographic, set elements for creating your own infographics. Vector illustration

Energy industry and ecology of Latvia vector map with power stations infographic.

Energy industry and ecology of Switzerland vector map with power stations infographic.

Energy industry and ecology of Costa Rica vector map with power stations infographic.

Energy industry and ecology of Iceland vector map with power stations infographic.

Isometric of nuclear power plants, vector, illustration.

Energy industry and ecology of Nagorno-Karabakh vector map with power stations infographic.

Energy industry and ecology of Uzbekistan vector map with power stations infographic.

Energy industry and ecology of Kyrgyzstan vector map with power stations infographic.

Energy industry and ecology of Poland vector map with power stations infographic.

Energy industry and ecology of Moldova vector map with power stations infographic.

Energy industry and ecology of British Virgin Islands vector map with power stations infographic.
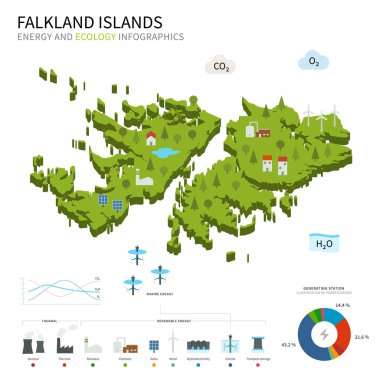
Energy industry and ecology of Falkland Islands vector map with power stations infographic.

Energy industry and ecology of Palestine vector map with power stations infographic.

Energy industry and ecology of Nepal vector map with power stations infographic.

Energy industry and ecology of Dominican Republic vector map with power stations infographic.

Energy industry and ecology of Romania vector map with power stations infographic.