
Analytics Flat four color minimal icon set
Business data market elements dot bar pie charts diagrams and graphs flat icons set isolated vector illustration.
Business infographic elements vector illustration

Arrow growth graphic icon vector illustration design
Infographics with a population

Illustration of colorful bar graph with rising arrow
Analytics blue and red four color minimal icon set

Financial Infographic set with charts and other elements. Vector illustration.
Steps process arrows. vector illustration
Layout for your options or steps. Abstract template for background.

Bar Chart blue gradient vector icon
Modern spiral infographics options banner. Vector illustration. can be used for workflow layout, diagram, number options, web design.
Four steps process - design element. Vector.

Timeline infographic with colorful icons and buttons on dark background, vector illustration
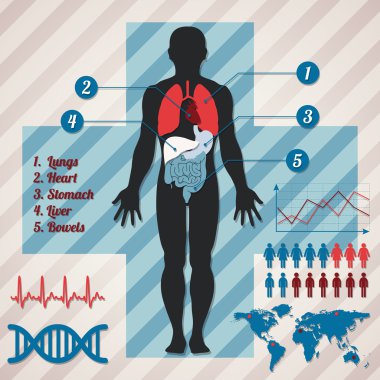
Medical infographics. Vector illustration

Digital market, finance bank, business rating vector infographics. Graphic design elements set. Histogram and diagram, radial bar, dot matrix, area, pie charts, line graph, choropleth dot world map.

Bar Chart Flat four color minimal icon set
Circle and triangle diagram charts. File document with diagram. Pie chart icon. Presentation billboard symbol. Supply and demand. Background with 4 options steps. Vector

Analytics golden line premium logo or icon
Infographics flowchart. Colored shadows scheme.

Set of infographic elements

Layout for your options or steps. Abstract template for background

Analysis Bars. Infography blue and red four color minimal icon set
Hand draw style vector abstract flow chart infographic elements
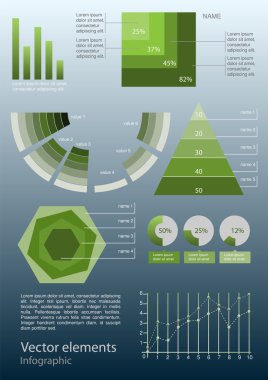
Vector infographic elements. vector illustration

Part of the report with logo and icons set. Vector infographic of technology or education process.

Vector colored numbered charts
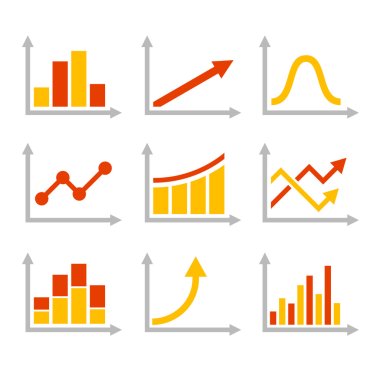
Color Graph Chart Icons Set. Vector illustration

Success graphic. Vector Illustration
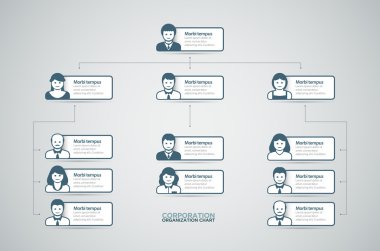
Corporate organization chart with business people icons. Vector illustration.

Analytics four color glass button icon
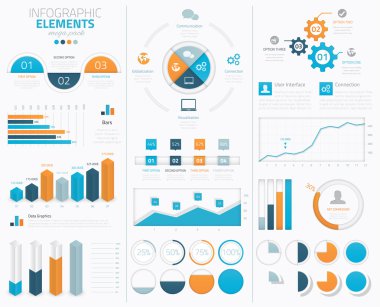
Big modern business infographic vector elements collection to display
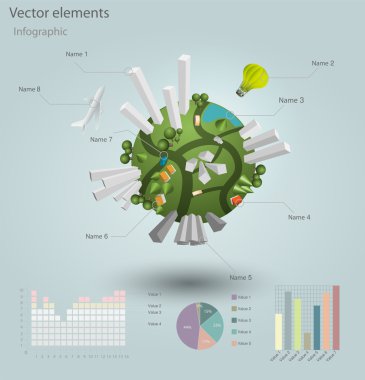
Infographics Industrial buildings and residential areas. Vector illustration.
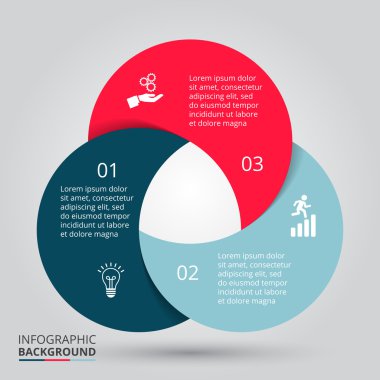
Vector circle element for infographic. Template for cycling diagram, graph, presentation. Business concept with 3 options, parts, steps or processes. Abstract background.
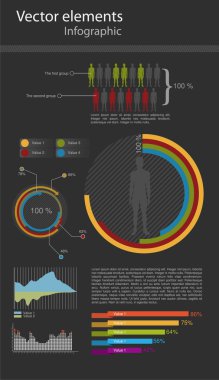
Vector infographic elements for the web and print usage
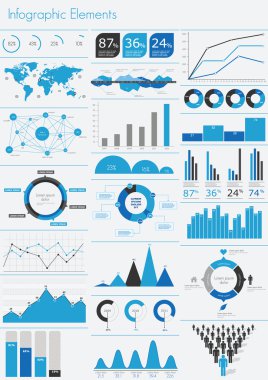
Detail infographic vector illustration. World Map and Information Graphics
Vector infographic elements. vector illustration
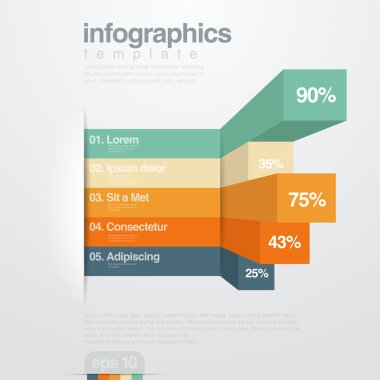
Infographics vector design template. 3D Charts diagram graph.

Set of infographic vector elements

One two three - vector paper progress steps for tutorial
Vector infographic elements. vector illustration
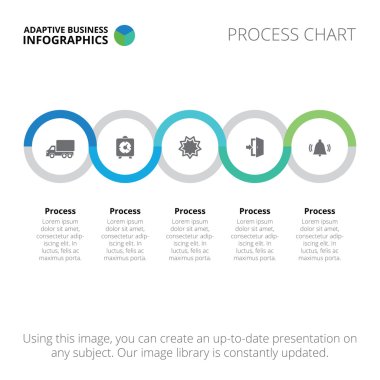
Editable infographic template of process chart, blue and green version

Vector infographic elements. vector illustration
Vector set of flat business chart icons
Set of infographic vector elements
Layout for your options or steps. Abstract template for background.
Set of infographic vector elements
Modern minimal colorful arrow infographics elements. Vector illustration. Can be used for workflow layout, diagram, number and step up options, web design.
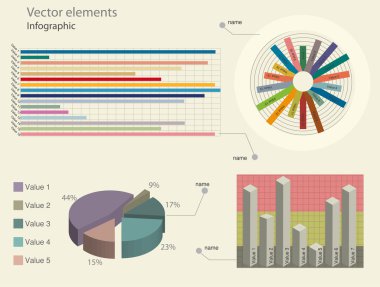
Infographic elements. Vector illustration.
Modern timeline design template. Vector illustration for your design

Vector infographic elements. vector illustration

Corporate design template on blue background. Black and white colors. Useful for advertising, presentations and web design.
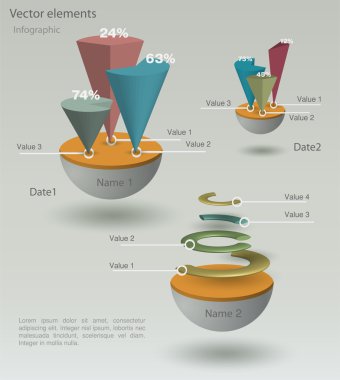
Paper Origami Infographic Elements
Three-dimensional pie charts and file icons

Set of infographic vector elements - colored pencils

Circle diagram sixty one percent pie chart 61. Circle percentage vector diagram. Flat vector illustration for web UI design, blue on white background.
Set of infographic elements

Thirty three percent chart, 33 percentage diagram. Vector circle chart design for web ui design. Flat vector illustration blue on white background.

Retro infographics set. World Map and Information Graphics

Infographics vector design template. EPS10

Bar Graph blue gradient vector icon

Circle diagram forty eight percent pie chart 48. Circle percentage vector diagram. Flat vector illustration for web UI design, blue on white background.

Business infographic elements, vector illustration

Circle diagram forty percent pie chart 40. Circle percentage vector diagram. Flat vector illustration for web UI design, blue on white background.
Colorful 3d diagram, vector illustration

Circle diagram fifty percent pie chart 50. Circle percentage vector diagram. Flat vector illustration for web UI design, blue on white background.
Set of infographic elements
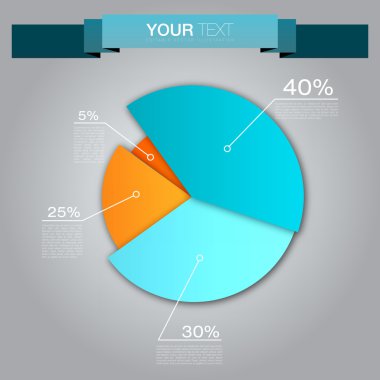
Pie Chart for Your Documents, Reports and Presentations

Retro infographics set. Vector illustration.

Vector design of infographic template
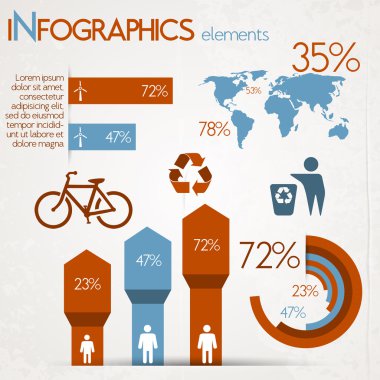
Ecology infographics collection, charts, symbols, graphic vector elements

Vector growing graph icon

Set elements of infographics
Business and finance icon set.Illustration eps10
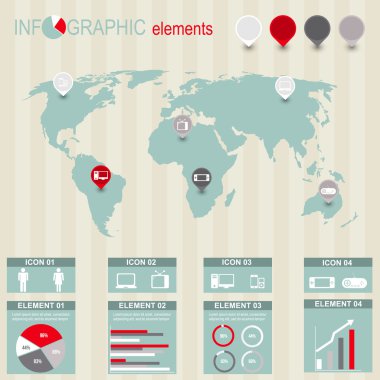
Set of infographic elements

Isometric cycle diagram for infographics in 4 parts. Vector chart can be used for graph, report, presentation, brochure, web design. 3d pie.
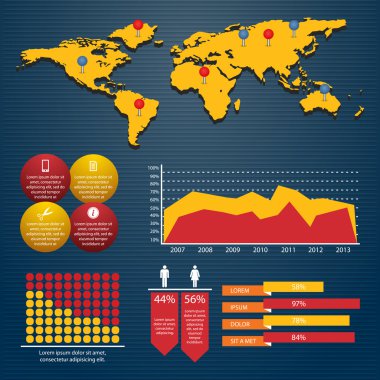
Retro infographics set. World Map and Information Graphics

Isometric cycle diagram for infographics in 4 parts. Vector chart can be used for graph, report, presentation, brochure, web design. 3d pie.
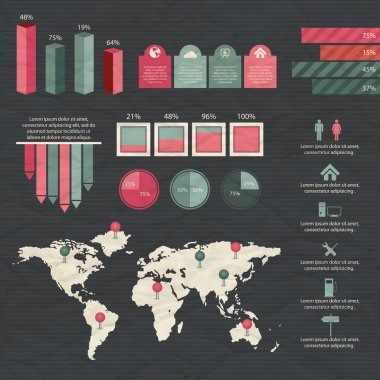
Colorful infographic elements and information graphic. Vector illustration

Isometric cycle diagram for infographics in 5 parts. Vector chart can be used for graph, report, presentation, brochure, web design. 3d pie.

Bar Chart blue and red four color minimal icon set

Layout for your options or steps. Abstract template for background
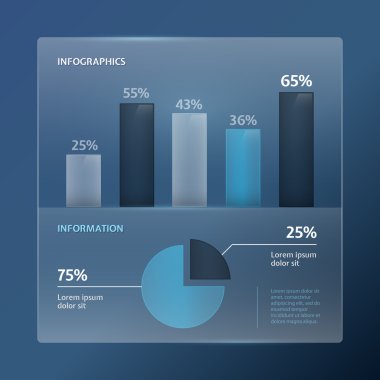
Detail infographic vector illustration

3d business growth bar graph illustration

Retro infographics set. World Map and Information Graphics

Timeline infographic template with 6 options on white background, vector illustration
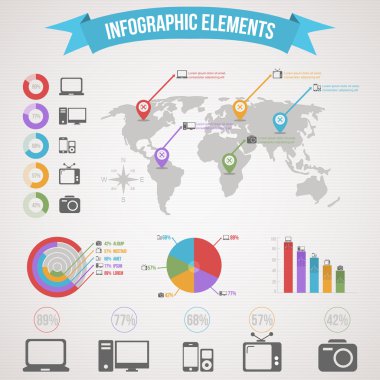
Business infographic elements vector illustration

Design elements. Vector illustration of business infographics. Set of 3D infographics with long shadow.
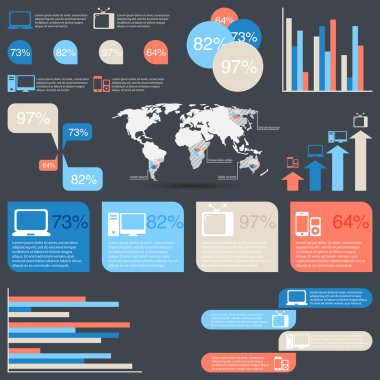
Business infographic elements vector illustration

Infographic diagram chart. Can be used for infographics

Business infographic elements vector illustration

Business Infographic icons. Vector illustration. can be used for workflow layout, banner, diagram, number options, web design, timeline template.
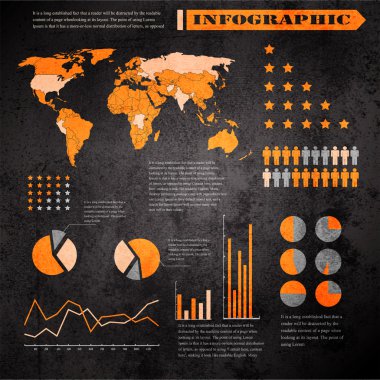
Business infographic elements vector illustration

Four Color Vector Chart Round
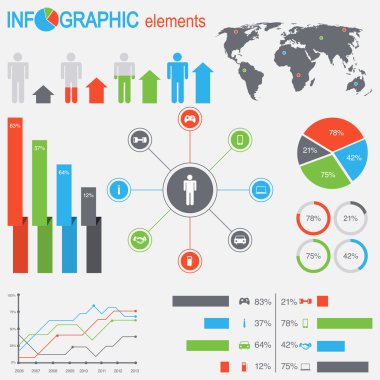
Set of infographic elements

Colorful vector chart with text and numbers
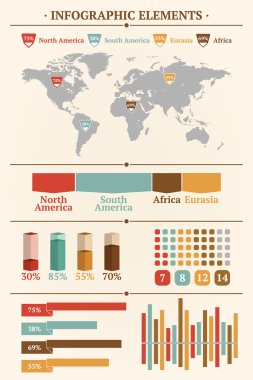
Retro infographics set. World Map and Information Graphics

Isometric cycle diagram for infographics. Vector chart can be used for graph, report, presentation, brochure, web design. 3d pie.

Set elements of infographics

Vector chart template with isometric stairs. EPS10