A Pack of Accounting Line Icons

A Pack of Accounting Glyph Icons

Business Data Graph and Charts Icon Collection

A word cloud of statistics related items

Business Data Graph and Charts Flat Icons

Business Data Graph and Charts Icon Set

Business Data Graph and Charts Vector Pack

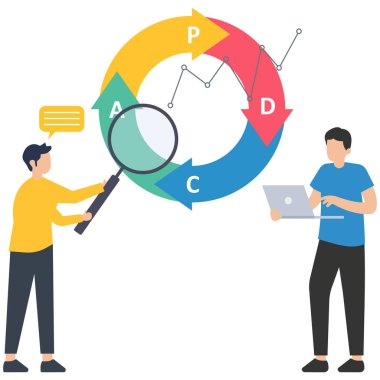
Statistical analysis. Man with magnifying glass analyzing data,Statistical methods

Business Data Graph and Charts Vector Icons

Business Data Graph and Charts Glyph Icons

Graphical Analysis Line Icons Pack

Business Data Graph and Charts Icon Collection

The difference of Quantitative Data (numerical measurements, statistical analysis) and Qualitative Data (observations and subjective interpretations) icon infographic diagram banner template. Vector.

Business Data Graph and Charts Icon Set

A bar graph with the infographics representing descriptive statistics

A presentation board with statistics making the icon for statistical inference

Data analytics vector illustration in flat color design

Analytics big data data analysis icon in Flat style

Data analytics vector illustration in solid color design

A bar graph with the infographics representing descriptive statistics

Business template for presentation in modern design of blue and orange. Contains comparative line charts, editable text with icons and ajdustable circular charts with percentage.

Statistics icon in doodle vector

RETENTION word cloud collage, business concept

Research Process and Methods, Type of Research From Application, Objectives and Information Sought

RETENTION word cloud collage, business concept background

Illustration of the word swot analysis in word clouds isolated on white backgroun

Word Cloud with Retention related tags, business concept

Retention word cloud, business concept

RETENTION word cloud, business concept

Silver retention sign hanging on the wall

Pixels vector illustration

Red oval retention tag. vector illustration

Business Data Graph and Charts Vector Pack

Abstract ball

Business Data Graph and Charts Vector Icons

An icon showing graphical infographics conceptualizing descriptive statistics

Descriptive Analytics web icon vector illustration

Graph with some values having focus and target arrow exact in the middle, presenting stats based targets icon

A globe with the line graph in magnifier characterizing analytical research

A bar graph with the statistics representing business infographic

Descriptive Analytics web icon vector illustration

Hierarchy of network representing descriptive statistics

An icon showing graphical infographics conceptualizing descriptive statistics

Arrows infographics representing descriptive statistics

Page showing graphs, bars an analysing the icon for statistical inference

Descriptive Analytics web icon vector illustration

Alphabets on a pie chart depicting process chart

A bar graph with the infographics representing descriptive statistics

Page showing graphs, bars an analyzing the icon for statistical inference

Circle shapes with layers depicting descriptive statistics

Infographic inside computer, financial data icon

Descriptive Analytics web icon vector illustration

Data analytics and etl line art icon set. database process and big data management outline icons with blue accents pack. business intelligence icons collection. data management symbol bundle.

Pixels

Descriptive Analytics web icon vector illustration

Descriptive Analytics web icon vector illustration

Descriptive Analytics web icon vector illustration

Wide opened eye with nodes on a webpage showing data visualization icon

A bar graph with the infographics representing descriptive statistics

Infographic featuring colorful interconnected puzzle segments, each adorned with business icons and descriptive text. Ideal for presentations, strategy planning, or educational purposes.

Arrows infographics representing descriptive statistics

A graph with curved shapes depicting descriptive statistics

An icon showing graphical infographics conceptualizing descriptive statistics

Big data management icon pack. data warehouse, analytics outline icons. minimal line art set for database and business intelligence. data processing icons pack for apps, infographic, and dashboard

Descriptive statistics compare with inferential statistics of sample and population

Database analytics outline with blue accent icon set. sql and nosql database line art symbol bundle. data science analytics sign pack. big data and database management icon set

Descriptive Analytics web icon vector illustration

Descriptive Analytics web icon vector illustration

Alphabets on a pie chart depicting process chart

Circle shapes with layers depicting descriptive statistics

Descriptive Analytics web icon vector illustration

Descriptive Analytics web icon vector illustration

Descriptive Analytics web icon vector illustration

Descriptive Analytics web icon vector illustration

Descriptive Analytics web icon vector illustration

Hierarchy of network representing descriptive statistics

Graph with some values having focus and target arrow exact in the middle, presenting stats based targets icon

A graph with curved shapes depicting descriptive statistics

A round graph with the infographics representing descriptive statistics

Descriptive Analytics web icon vector illustration

Futuristic hud banner that have word case study on user interface screen on blue background

A globe with the line graph in magnifier characterizing analytical research

Page showing graphs, bars an analyzing the icon for statistical report

An icon showing graphical infographics conceptualizing descriptive statistics

A round graph with the infographics representing descriptive statistics

Descriptive Analytics web icon vector illustration

Descriptive Analytics web icon vector illustration

Descriptive Analytics web icon vector illustration

Descriptive Analytics web icon vector illustration

Descriptive Analytics web icon vector illustration

Circle shapes with layers depicting descriptive statistics

Circle shapes with layers, descriptive statistics

Descriptive Analytics web icon vector illustration

Vibrant design featuring a visually appealing infographic illustrating a 30, 60, and 90-day plan with descriptive text. Ideal for presentations, business strategies, and organizational themes.

Descriptive Analytics web icon vector illustration

A bar graph with the statistics representing business infographic

Page showing graphs, bars an analyzing the icon for statistical report