Description:
The Hemoglobin A1C SVG vector features a detailed representation of the hemoglobin molecule associated with diabetes management. This graphic is designed in SVG format, making it scalable for various applications while maintaining clarity. The design includes elements that depict the molecular structure, making it suitable for educational and professional use. Its style is flat, enabling easy integration into presentations or documents. The vector format allows for customization, whether for digital or print media. This graphic serves as a useful tool for healthcare professionals and educators alike. Its clarity and precision make it an effective visual aid for conveying important health information. Use it in classroom settings, health brochures, or medical reports.
Usage ideas:
This Hemoglobin A1C SVG vector can be utilized in diverse sectors, such as healthcare, education, and research. For instance, educators can use it in lesson plans about diabetes and its management, helping students grasp complex topics more effectively. Medical professionals may incorporate this image into informative pamphlets for patients, illustrating the importance of regular A1C testing. Additionally, it can be featured in presentations at healthcare conferences, enhancing the visual appeal and understanding of diabetes-related discussions. Graphic designers can also apply this vector in crafting engaging infographics that elucidate health statistics related to hemoglobin levels.

3D Isometric Flat Vector Conceptual Illustration of Glycated Hemoglobin, A1C Blood Sugar Test

3D Isometric Flat Vector Conceptual Illustration of Glycated Hemoglobin, A1C Blood Sugar Test with Glucose Level Measurement

A1C blood sugar test with glucose level measurement list outline diagram. Glucose result scale with diabetes risk, normal and healthy diagnosis vector illustration. Educational medical checkup control

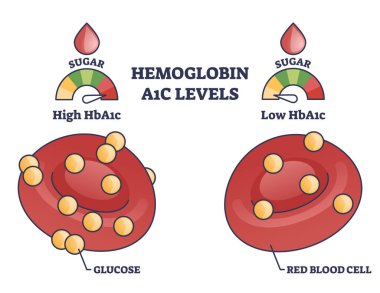
Hemoglobin A1C test levels with red blood cell and glucose outline diagram. Labeled educational scheme with diabetes or prediabetes checkup principles and low or high results vector illustration

Illustration of Hemoglobin A1c levels and risk

Hemoglobin A1C test for prediabetes and diabetes checkup outline diagram. Labeled educational scheme with bloodstream glucose level measurement vector illustration. Sugar control, monitoring in blood

Illustration of blood glucose levels and hemoglobin A1c

Diabetes management concept. Vector of a doctor giving consultation to a diabetes mellitus type 1 patient on how to keep under control blood glucose level with insulin and pills

Diabetes diagnosis result chart. Blood sugar levels test. A1c, fasting blood sugar test, glucose tolerance test compare.

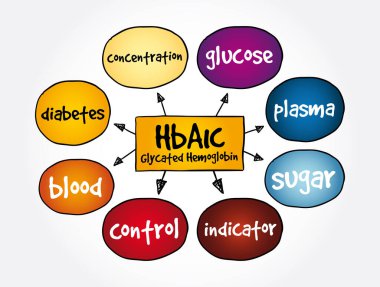
HbA1c Glycated hemoglobin mind map, medical concept for presentations and reports

HbA1c Glycated hemoglobin mind map, medical concept for presentations and reports

A1C Test Meter, Diagnosing Prediabetes, Hemoglobin Blood Test, Tube with blood, Medical Test blood sample, test result negative

Illustration of blood glucose levels and testing

Illustration of normal, prediabetic, and diabetic ranges

A1C High Test Meter, High Diagnosing Prediabetes, Hemoglobin Blood Test, Tube with blood, Medical Test blood sample, test result negative

Average glucose level infographics. Monitoring and managing your blood sugar levels. Diabetes risk, Prediabetes and In range. Vector illustration

Diabetic Hyperglycemic Hyperosmolar Syndrome

Hemoglobin A1C or HbA1c test for sugar level in bloodstream outline diagram. Labeled educational scheme with laboratory measurement for diabetes glucose and glycation checkup vector illustration.

Hba1c hemoglobin a1c icon

Glucose level. Monitoring and Managing Your Blood Sugar Levels for Optimal Health. Diabetes risk. Vector illustration