
Heart beat on colored round web buttons

An image of a line graph arrow process chart.

Stethoscope and heartbeats on graph paper illustration

Human brain and brain graph on grids illustration

Little girl solving graph problem illustration

Girl and different types of graphs illustration

Illustration of a stage with a boy presenting a line graph

AI time series analysis vector icon. Includes clock, waveform graph, and circuit lines. Thin blue outline on dark blue circular background. Represents data tracking, machine learning, and smart time-based analytics.

Vector pencils and mathematical function graph

Set of inch, metric rulers. Measuring tool. Scale for ruler in centimeters, inches. Inches, centimeters measuring scales. Metrics indicator cm, inch. Measuring chart 10, 30 centimeters, 4, 12 inches.

Vector Infographic timeline report template with the biggest milestones, icons, years and description
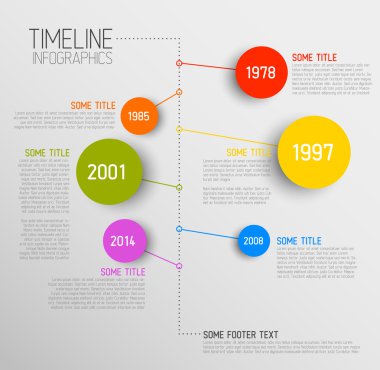
Vector Infographic timeline report template with icons
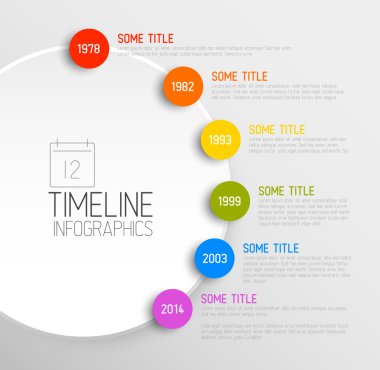
Vector Infographic timeline report template with icons

Vector Infographic diagonal timeline report template with icons

Vector illustration of Algebra doodle background
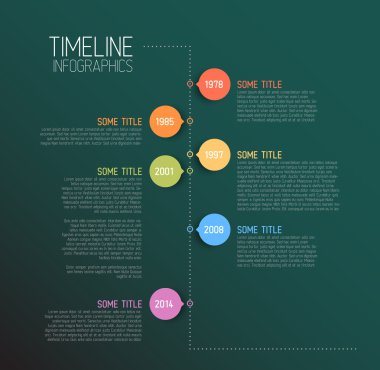
Vector Teal Infographic timeline report template with icons - retro version

Vector Infographic timeline report template with paper bubbles, photos and fresh colors - dark version

Vector Infographic timeline report template with the biggest milestones, icons, years and color buttons

Vector Infographic timeline report template with the biggest milestones, icons, years and color buttons. Business company overview profile - red dark version.

Vector Infographic timeline report template with the biggest milestones, icons, years and color buttons. Business company overview profile - blue version.

Vector Infographic timeline report template with the biggest milestones, icons, years and color buttons. Business company overview profile.

Vector Infographic timeline report template with icons - dark background version

Full year timeline template with all rainbow colored months on a horizontal curved time line as a big stripes in one long row, month names and short descriptions, all on white background

Full year timeline template with all months on a diagonal time line - dark version

Pyramid graph template with four colorful steps. Easy to use for your website or presentation.
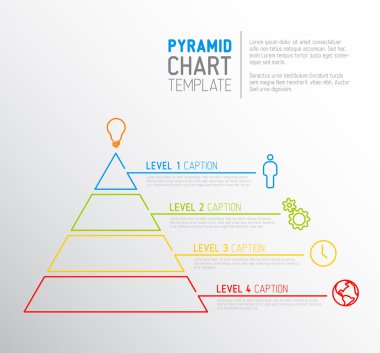
Vector Infographic Pyramid chart diagram template

Vector Maslow Infographic stipe layers template with five levels - color pyramid template on dark background with icons and descriptions made from overlay blocks

Vector Infographic report template design with paper labels stickers and column stripes. Simple infochart or column graph template, semi transparent horizontal timeline.
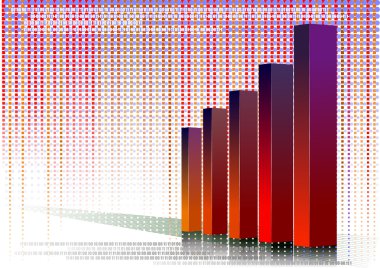
Three-d bar chart and upwards line graph financial diagram illustration over square grid

Grow chart line icon. linear style sign for mobile concept and web design. Statistic, diagram outline vector icon. Symbol, logo illustration. Vector graphics

Bar Chart with arrow line icon. linear style sign for mobile concept and web design. A rising line graph outline vector icon. Growth, analytics symbol, logo illustration. Vector graphics

Business infographic design vector can be used for workflow layout, diagram, annual report.

Vector timeline infographics, the conceptual branch - time and colorful leaves - events

Full year timeline template with all months on a horizontal time line as a big overlayed circles - dark version

Infographic startup milestones timeline vector template.

Vector Infographic timeline report template with icons

Vector Infographic timeline report template with icons

Vector Infographic multi timeline report template with the biggest milestones, icons, years - vertical ligh version

Negative red graph with columns in grid vector template illustration

Hand drawn icons and elements pattern. Digital illustration

Infographic startup milestones timeline vector template with polygonal world map.

Vector - mathematical physics - the formulas and graphs - electricity, magnetism

Vector - atom, quantum physics, molecule, hydrogen,

Pyramid graph template with five steps - blue version. Easy to use for your website or presentation.

Vector Infographic timeline report template with the biggest milestones, icons, years and color buttons - blue vertical time line version
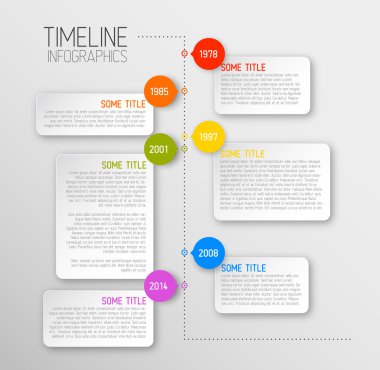
Vector Infographic timeline report template with icons

Vector dark horizontal Infographic timeline report template with icons

Vector Infographic timeline report template with icons and descriptive bubbles

Full year timeline template with all months on a horizontal time line as a big relief circles with months names and some descriptions dark version

Timeline Infographic template with icons

Full year timeline template with all months on a vertical time line

Vector Infographic timeline report template with the biggest milestones, icons, years and color buttons - vertical version

Full year timeline template with all months on a horizontal time line

Vector dark Infographic timeline report template with icons

Infographic design template. Creative concept with 3 steps. Can be used for workflow layout, diagram, banner, webdesign. Vector illustration
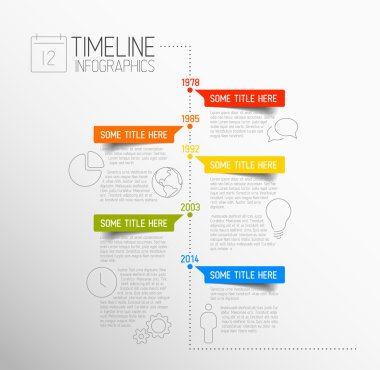
Vector Infographic timeline report template with icons

Vector heart love Infographic report template made from lines and icons
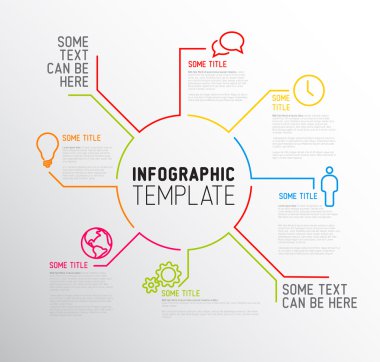
Vector Infographic report template made from lines and icons

An image of a 3d profit line chart.

Set of hand drawn graphs and charts

An image of an exponential growth chart.

Doodle business line graph on white background vector illustration

An image of 3d pie chart steps.

Vector Infographic report template made from lines and icons.

Growth chart icon vector. Thin line sign. Isolated contour symbol illustration

Vector Infographic timeline report template with the biggest milestones, icons, years and color buttons - vertical time line version

An image of a stock market chart.

Bar graph on white background doodle vector illustration

Trading exchange seamless pattern background. Vector illustration doodles, thin line art sketch style concept

Vector Infographic timeline report template with icons

Vector background with diagram; clip-art

Vector minimalist diagonal timeline report template Infographic with circles

Infographic timeline report template with icons and labels, World map, Vector illustration

Growth see the future concept vector illustration design

Vector Infographic timeline report template with icons and rounded labels

Vector timeline Infographic report template with paper stripes and icons

Timeline Infographic brochure with icons.

Black and green line Pie chart infographic icon isolated on white background. Diagram chart sign. Colorful outline concept. Vector Illustration

Vector illustration of Infographic timeline report template with icons

Vector Infographic timeline report template with colorful bubbles

Vertical Vector Infographic timeline template

Blue Business News Concept Icon Design Clipart in Editable Vector Format

Vector Infographic timeline report template with icons and white labels
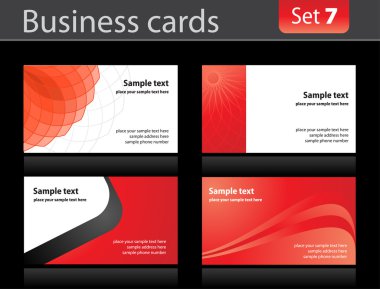
Business cards templates

Vector timeline Infographic report template with paper stripes and icons

Vector Timeline Infographic with diagrams and text.

Business infographic design vector can be used for workflow layout, diagram, annual report.

Set Pie chart infographic icons isolated on black and white background. Diagram chart sign. Line, outline and linear icon. Vector Illustration

Vector Infographic timeline report template with icons

Vector timeline Infographic report template with paper stripes and icons

Vector Infographic report template made from lines and icons.

Infographic template with lines with peaks, graph theme

Vector horizontal Infographic timeline report template with icons and rounded labels

Dark Vector Infographic timeline report template with icons

Infographic timeline report template with icons and labels, Vector illustration

Vector Infographic Pyramid chart diagram template with icons, made by thin line

Vector timeline Infographic report template with paper stripes and icons

Infographic startup milestones timeline vector template.

Vector infographic report timeline. EPS10

Vector Infographic timeline report template with lines and icons