
Vector glossy diagram and pie charts

Colorful 3d circular diagram

50 business concept filled icons

Vector illustration of Isometric Arrow Path Infographic design element.

Diagram and graph icons with reflect on white background, stock vector

3d financial graph stat business background

Web banner design with business concept elements.

Pie chart with four color columns and text

This image is a vector file representing a 3d Pie Chart, all the elements can be scaled to any size without loss of resolution.
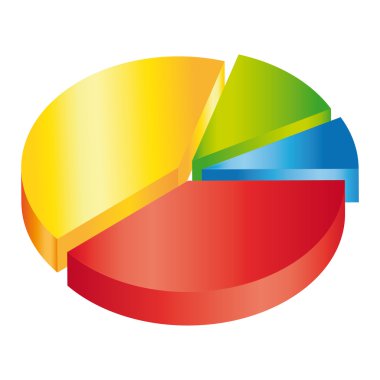
Colorful 3d pie chart

Color circle graph for design and business concept

Pie chart with divided segments in 3d Visualization in multiple colors on white background. Circle pie chart in 1,2,3,4,5,6,7,8,9,10,11,12 sections or segments. Used for analyzing data.

Color graph for design and business concept

9 part, section segmented circle. Abstract dashed lines circular geometric element - stock vector illustration, clip-art graphics

Donut charts, pies segmented on 9, 10, 11, 12 equal parts. Wheels divided in sections. Set of infographic multicoloured diagrams. Circle section minimalist graph. Pizza chart round icons. Loading bar.

Vector circular diagram

Circle vector diagram. EPS10 vector
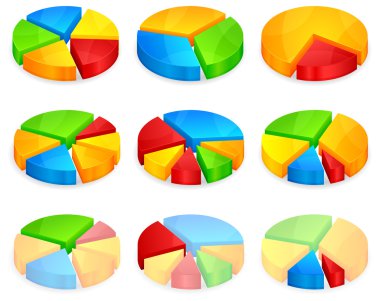
Color circular diagrams with different size pieces, vector illustration

Circular diagram colorful. Vector illustration
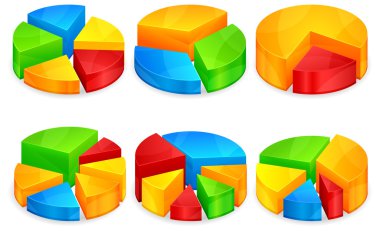
Color circular diagrams with different size growth pieces, vector illustration

Color round diagrams - vector set of infographic

Illustration of pie chart on white background

Pie charts with different number of parts

Donut charts, pies segmented on 10, 11, 12 equal parts. Wheels divided in sections. Diagrams infographic multicoloured collection. Circle section minimalist graph. Pizza chart round icon. Loading bar.

This image is a vector file representing a 3d Pie Chart, all the elements can be scaled to any size without loss of resolution.

Set of colorful vector circular diagrams for your presentations

Infographic 25 percent/ on white background

Color circular diagrams with different size pieces, vector illustration
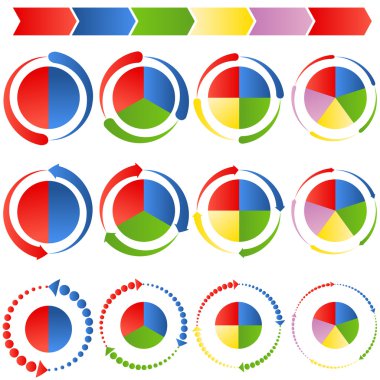
An image of a process arrow pie charts.

Circle colorfull shiny vector graph infographic icon

Volume round chart with four parts

3d circular diagram

Big pie chart with four pattern different colors

10 part, section segmented circle. Abstract dashed lines circular geometric element - stock vector illustration, clip-art graphics

Pie circular diagrams with different size and pastel colours pieces, vector illustration

Business 3D charts

3d financial graph stat business background
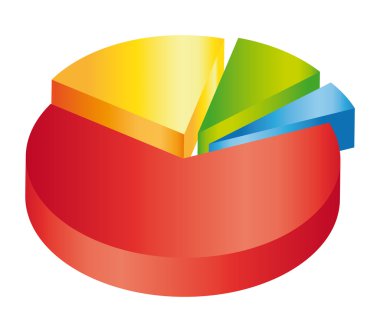
Colorful 3d pie chart ll

Pie chart template - circle diagram for business report or presentation

Set, collection of blue pie charts, diagrams, white background

Illustration of pie chart on white background

Pie Chart over white. EPS 10, AI, JPEG

Pie chart consist of coin parts. Eps8. CMYK. Organized by layers. Global colors. Gradients used.

Big pie chart with four pattern different colors
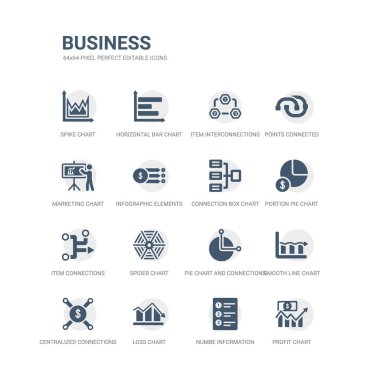
Simple set of icons such as profit chart, numbe information, loss chart, centralized connections, smooth line chart, pie and connections, spider item connections, portion pie connection box related

Graph icons on white background

Set, collection of colorful pie charts, diagrams, white background

Illustration of sticker of pie chart on abstract background

Business icon over gray background vector illustration

Vector set of pie charts on white background

3d round diagram - vector illustration

3d financial graph stat business background

Colourful 3d pie chart icon - circle diagram

An image of a food plate guide.

Diagram and graph icons with long shadow, stock vector

Set of Pie Chart icons. Illustration on white background

Vector illustration for your design

Share icon

An image of a various colorful circle arrows with transparent drop shadows.

Color graph, circular diagrams, arrow and person symbol, vector illustration

Vector 3d and 2d pie chart. All elements are layered separately in vector file.

Flat design icon of pie chart or graph - vector graphic. This graphic icon can also represents business report, financial growth, percentage

Percentage vector infographics. Pie chart statistic concept. Business flow process diagram. Infographic elements for presentation.

Economic diagram line flat icons with long shadow, stock vector

Color graph for design and business concept - red vector

3d financial graph stat business background

Vector illustration of upward arrow with colorful pieces

Vector Business Icons Set 1

Illustration of pie chart on white background

An image of a process target pie charts.

Infographics business template with options for Presentation, Sale forecast, Web design, Improvement, Step by Step

Two square charts with growth and decline

Economic and investment diagram line icon flat color, stock vector

Progress statistic concept. Infographic vector template for presentation. Business flow process steps. Timeline statistical chart.

Set mathematical fractions parts of ring template for infographics. Vector illustration.

Figure man holds graph of healthy diet

Economic and investment diagram line icon with reflect, stock vector

Progress statistic concept. Infographic vector template for presentation. Business flow process steps. Timeline statistical chart.

Set of 16 vector stroke icons such as numbe information, loss chart, centralized connections, smooth line chart, pie chart and connections, spider from business concept. can be used for web, logo,

Vector illustration of business concept with calculator icon and finance cake diagram

Equal Section Pie Chart Vector Illustration

Set of 40 flat business web icons in line style such as horizontal bar chart, credit card and ticket, bars graphic, euro coins stack, stats pyramid, item interconnections, little shop with awning

An image of a food plate guide.

Infographics business template with options for Presentation, Sale forecast, Web design, Improvement, Step by Step

Economic and investment diagram line icon on gray background, stock vector

Pie chart vector icon. Color wheel divided into sectors.

Pie chart, pie graph, diagram vector illustration. A clipart for infographics, visualization, infographic theme

Illustration of gear shape pie chart on isolated background

Vector graphic

0% female, 100% male comparison infographic. Percentage men and women share. Vector chart.

1% female, 99% male comparison infographic. Percentage men and women share. Vector chart.

Set of infographics - vector elements

99% female, 1% male comparison infographic. Percentage men and women share. Vector chart.

Set of diagram and graph icons on gray background, stock vector

Illustration of gear shape pie chart on isolated background

Illustration of gear shape pie chart on isolated background

Food value label chart. Vector information beverage guideline table

Set of diagram and graph icons on white background, stock vector

Progress statistic concept. Infographic vector template for presentation. Business flow process steps. Timeline statistical chart.

Set of infographic icons circles divided by radius into sectors, vector of the circle sector for visualization of infographic data information